

HeartLogic Sensors Provide Objective Measure of Heart Failure Physiology
Summary
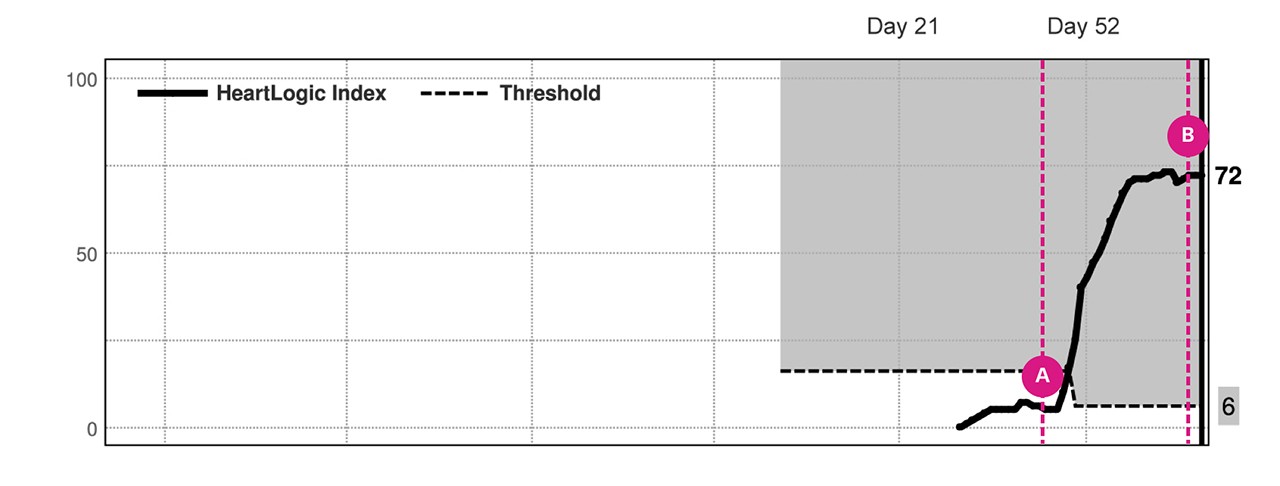
(A) Day 42: Patient implanted with a Resonate™ family CRT-D was admitted to the hospital for heart failure symptoms, including abdominal pain. Patient discharge occurred on Day 42 after implant without eliminating the abdominal pain.
Day 48: HeartLogic alert was triggered on Day 48, but the LATITUDE Communicator was not set up and therefore the alert was not communicated.
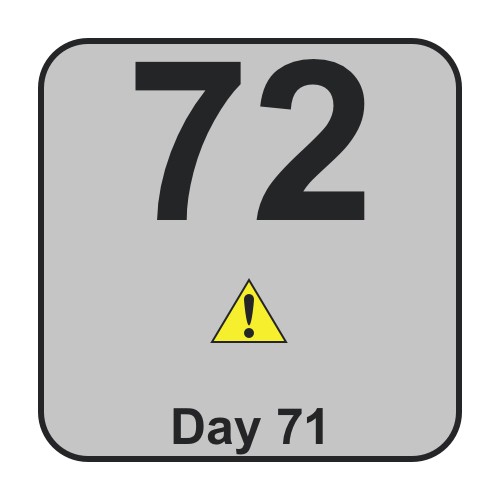
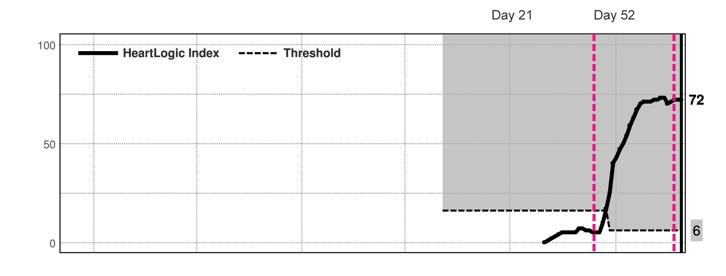
(B) Day 57: The patient presented to the emergency department (ED) on Day 57 with complaints of shortness of breath, difficulty sleeping and continuing vague abdominal pain. Physical exam did not find swelling in the ankles or obvious edema. Patient was considered for discharge but then the device was interrogated using LATITUDE Consult™, which detected a highly elevated HeartLogic index.
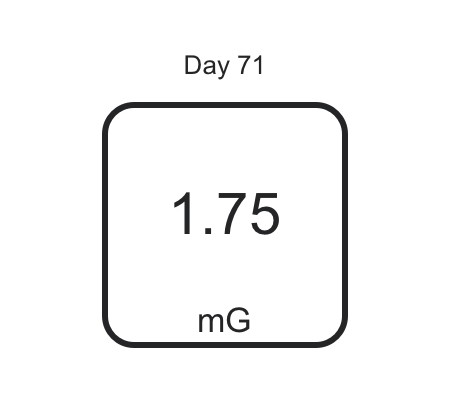
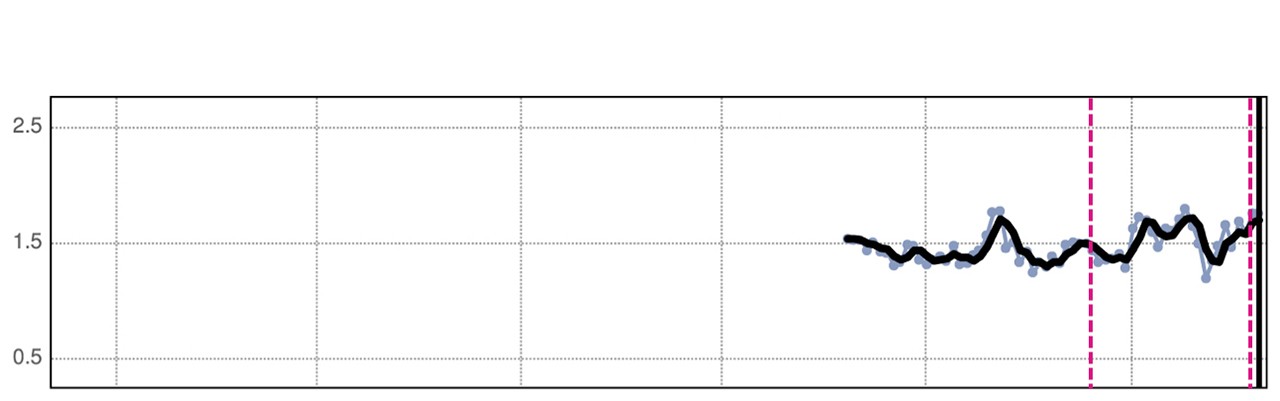
The S3 heart sound, respiratory rate and night heart rate were all significantly elevated, beginning at the prior hospital discharge.
Diuretic treatment resulted in significant fluid loss, which had been stored in the abdomen. Additional work-up detected coronary artery disease, which was treated with coronary stenting.
Because at admission to the ED, the patient had not yet connected the LATITUDE Communicator, the HeartLogic index was not known. The ED was ready to discharge the patient, but interrogation of the device revealed the HeartLogic data and elevated index. Therefore, that decision was reversed and the patient was treated for worsening heart failure and discharged after symptoms resolved to be monitored remotely.
Clinical Data
HeartLogic™ Heart Failure Index
Contributing Trends
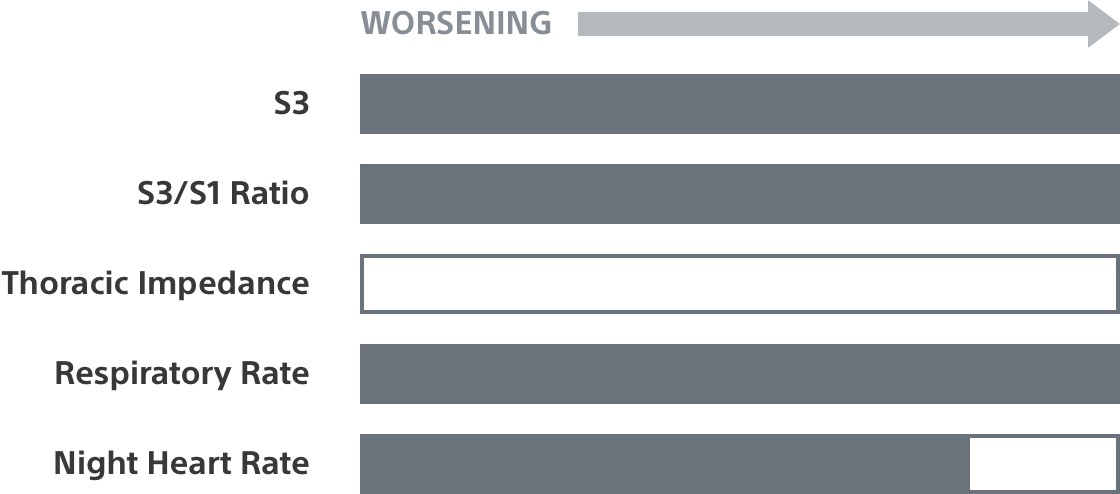

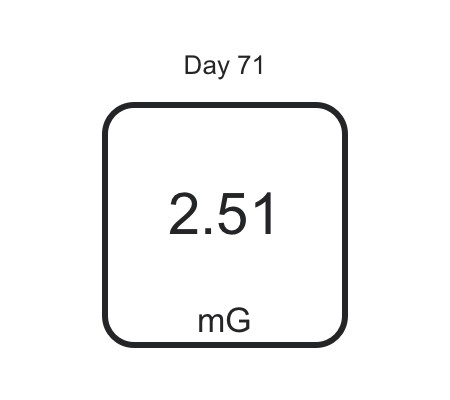
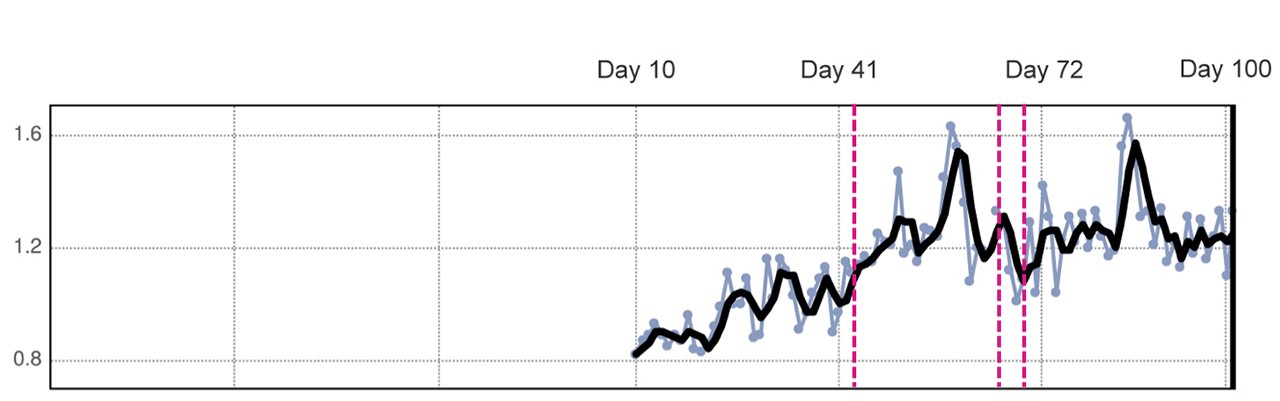
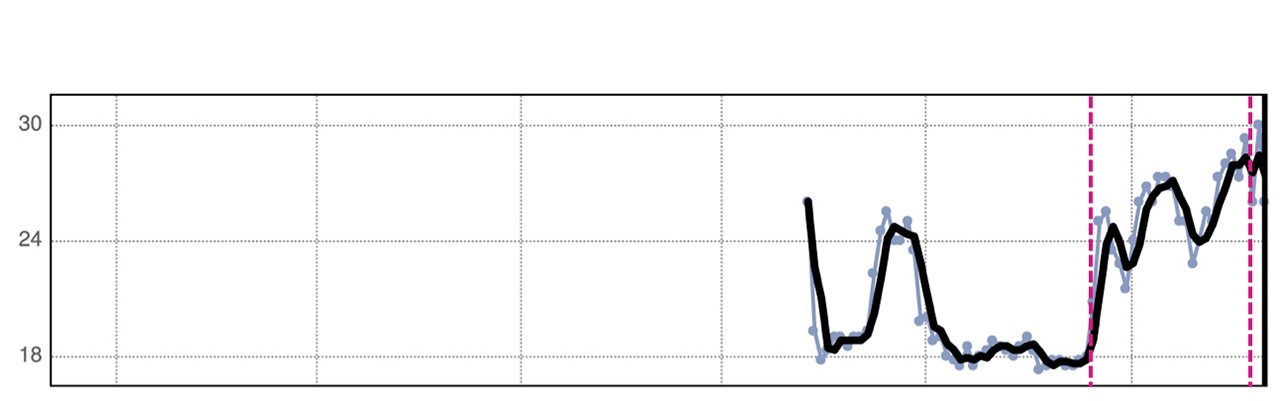
S3
S1
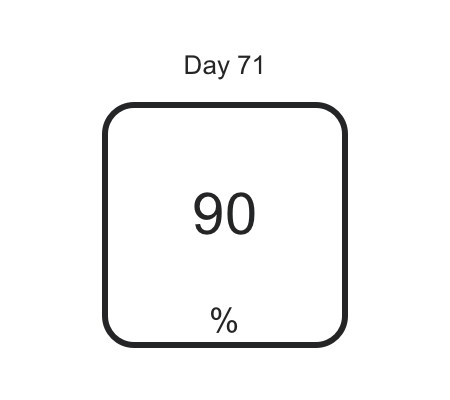
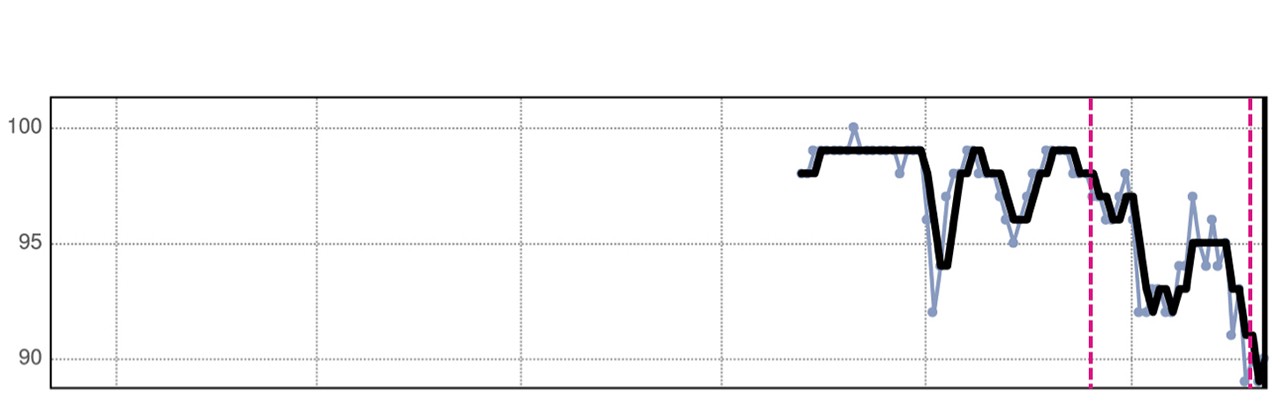
Thoracic Impedence

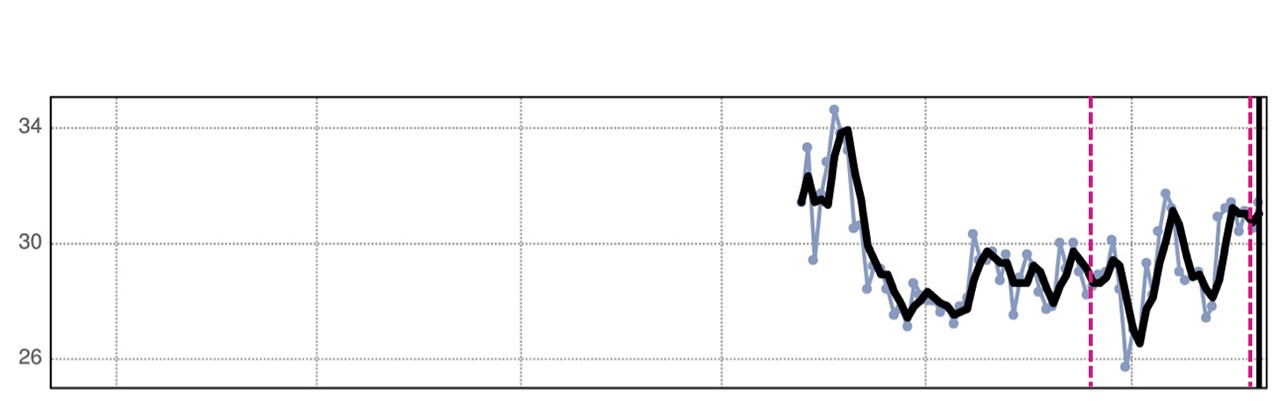
Respiratory Rate
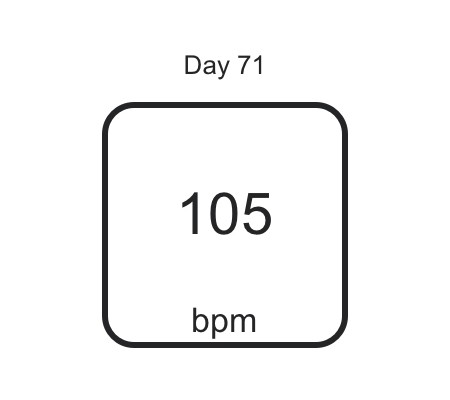
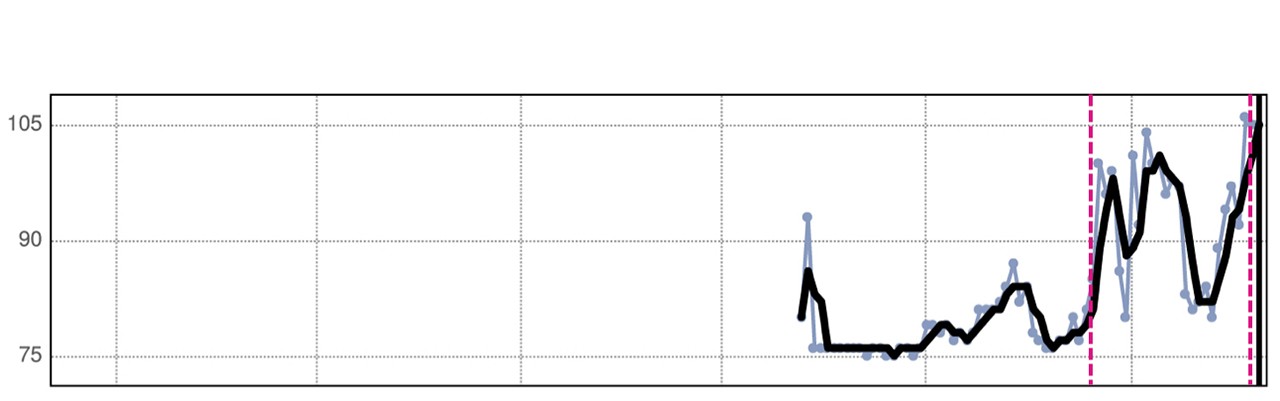
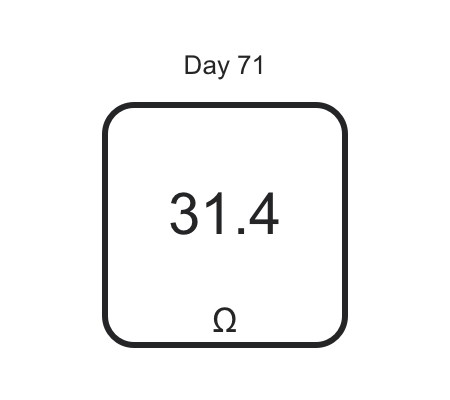
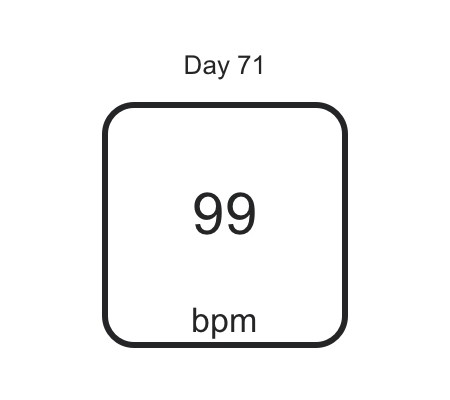
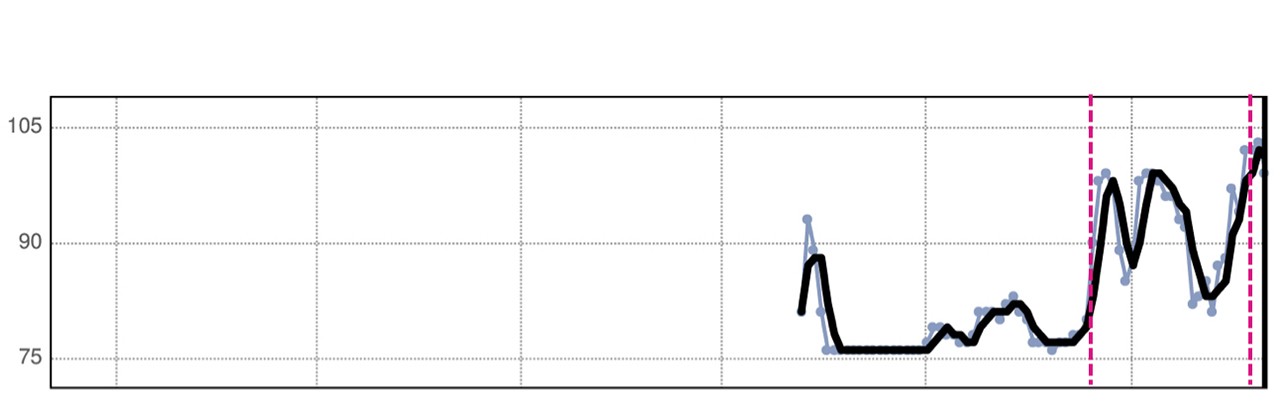
Night Heart Rate
Sleep Incline

Weight
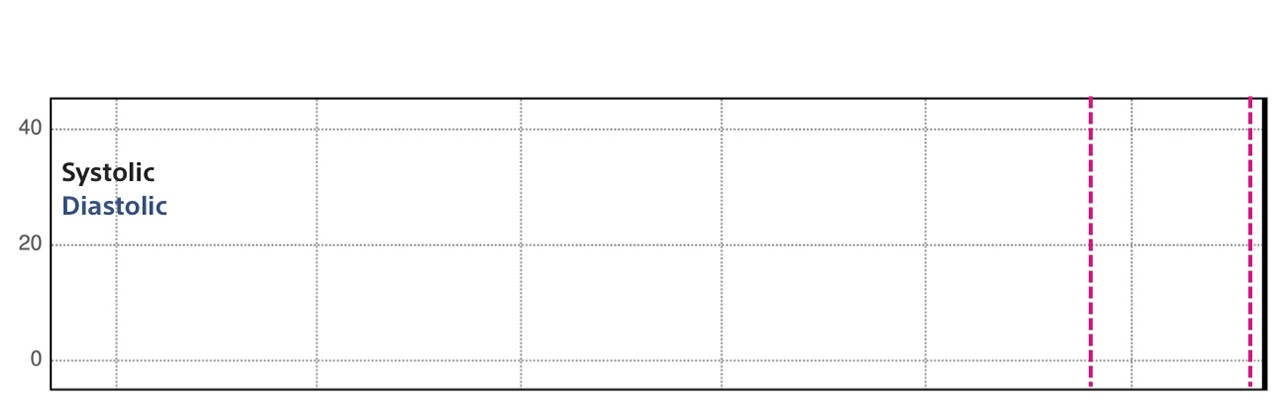
Blood Pressure
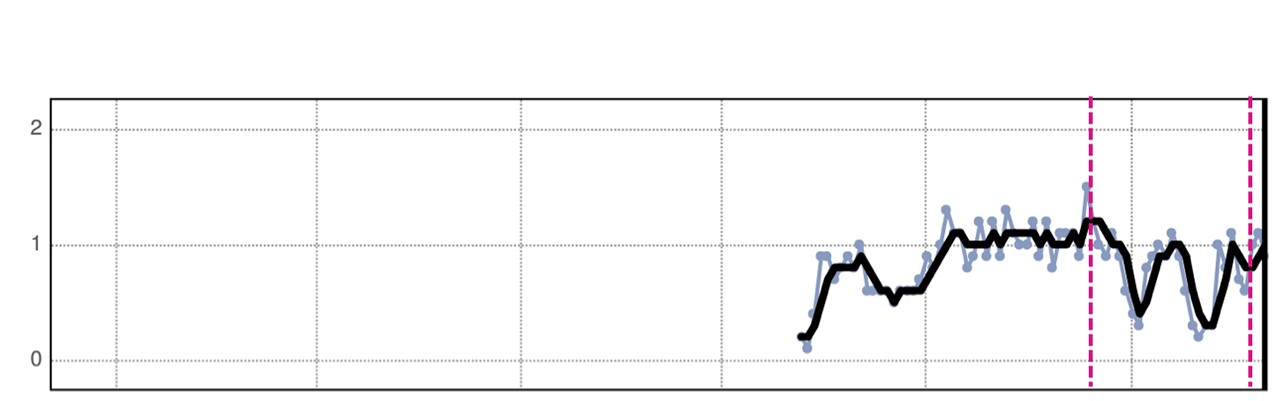
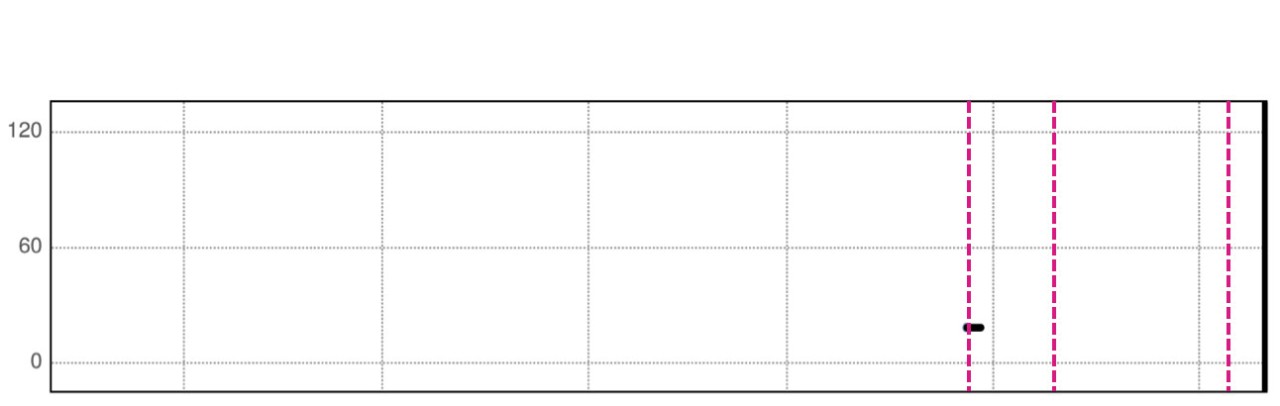
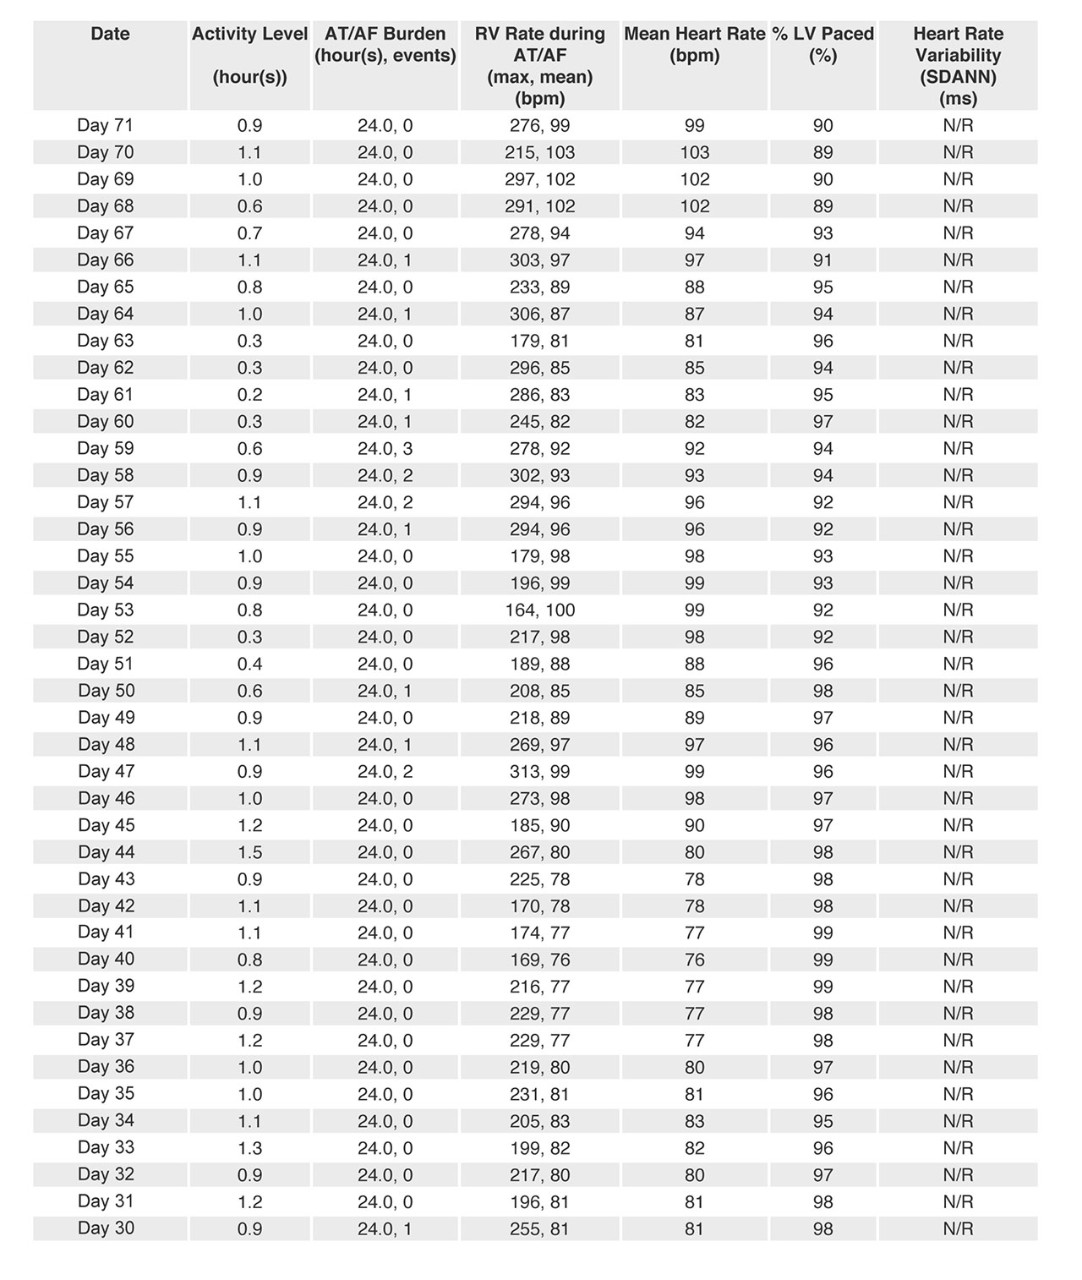
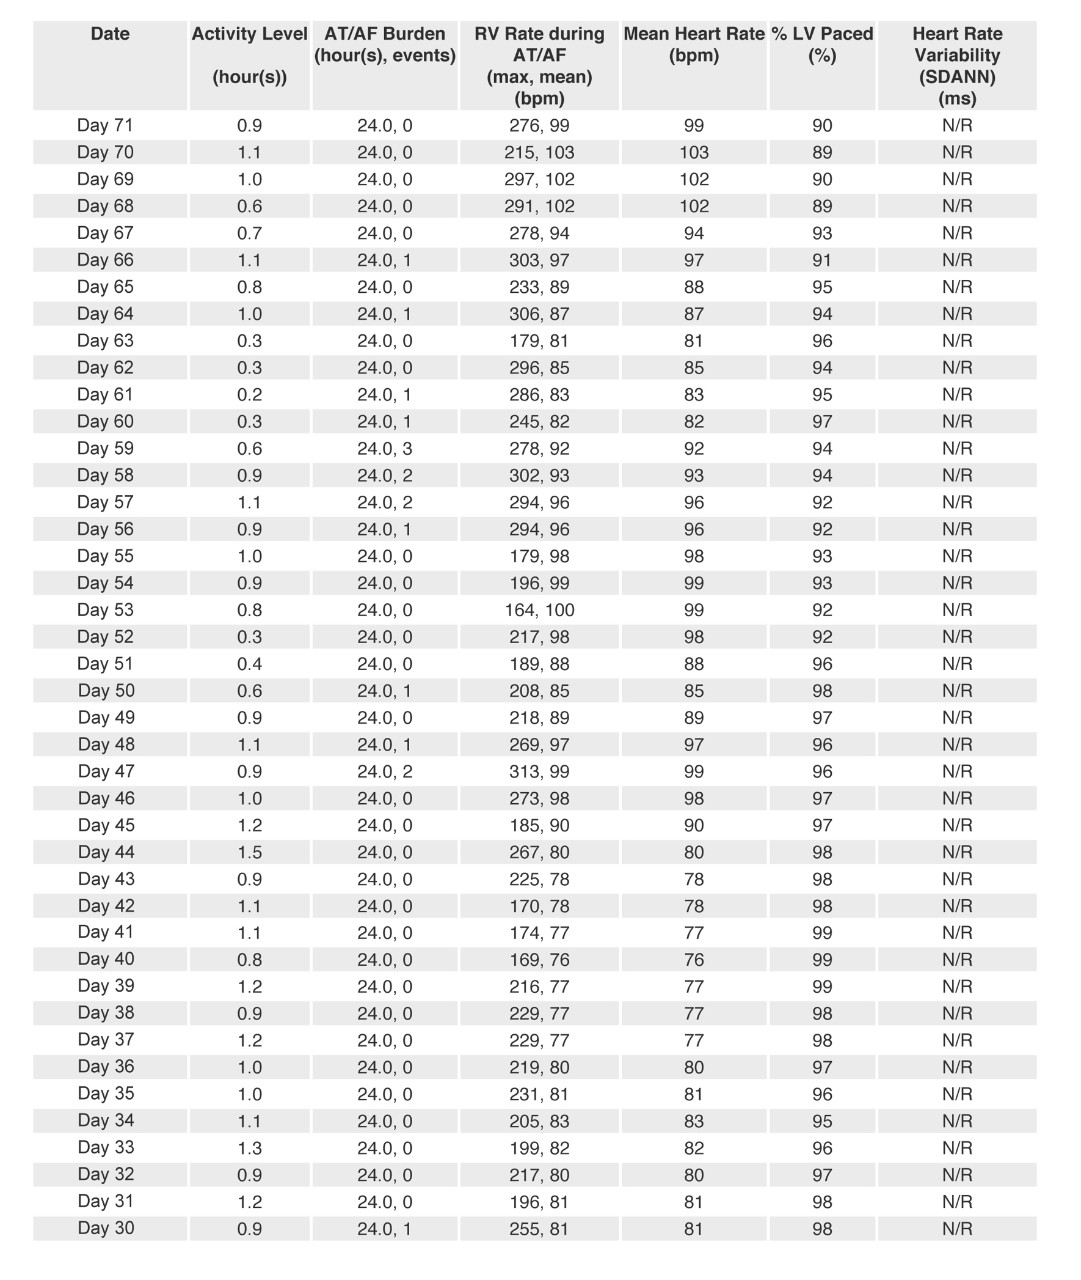
Activity Level
AT/AF Burden

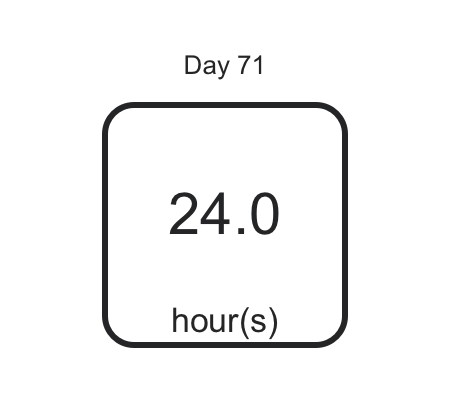
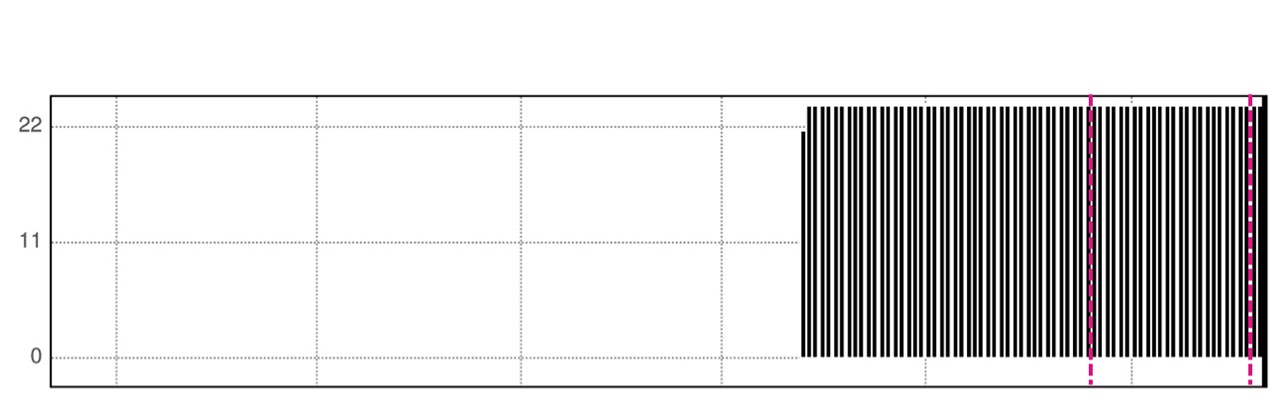
V Therapy
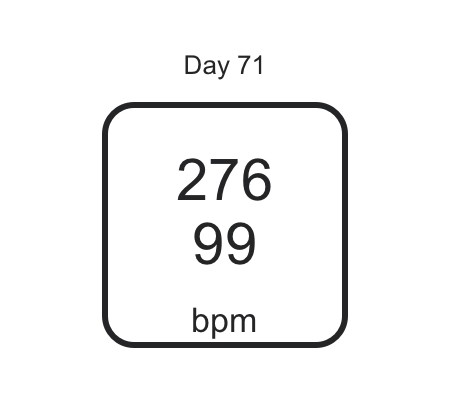
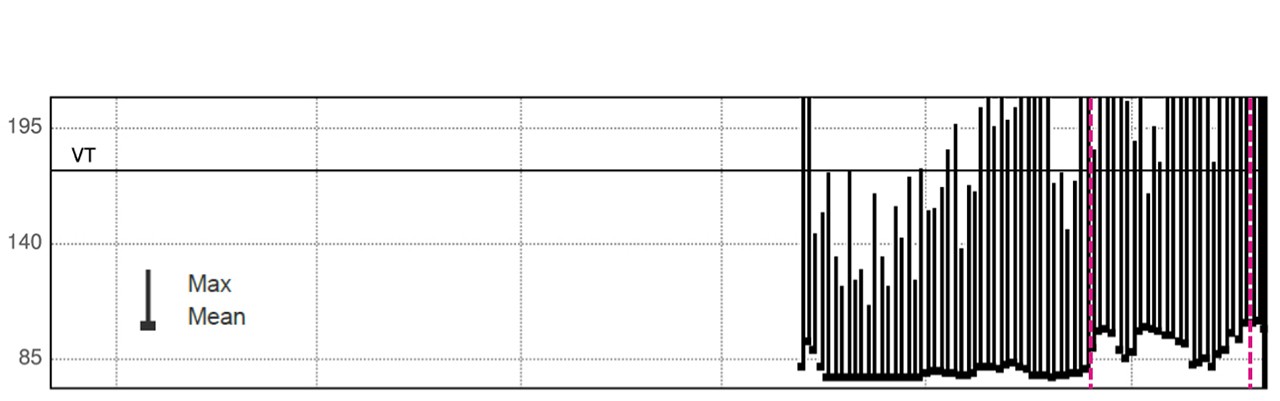
RV Rate during AT/AF
Mean Heart Rate
% LV Paced
Heart Rate Variability (SDANN)
LATITUDE® Patient Management - Heart Failure Management Report
Explore More Case Studies
Discover the importance of a multi-sensor approach in evaluating worsening heart failure.
Find out how a HeartLogic alert led to remote monitoring compliance and a 30-pound weight loss.
See how a HeartLogic alert detected signs of worsening heart failure due to medication non-compliance.
References
1. Boehmer JP, Hariharan R, Devecchi FG, et al. A Multisensor algorithm predicts heart failure events in patients with implanted devices: results from the MultiSENSE study. JACC Heart Fail. 2017 Mar;5(3):216-25.
Results from the case studies are not necessarily predictive of results in other cases. Results in other cases may vary.