HeartLogic Clinical Data
Explore clinical data and real-world evidence demonstrating how HeartLogic Heart Failure Diagnostic can help give you the actionable information you need to change patients’ lives—before you expect it.
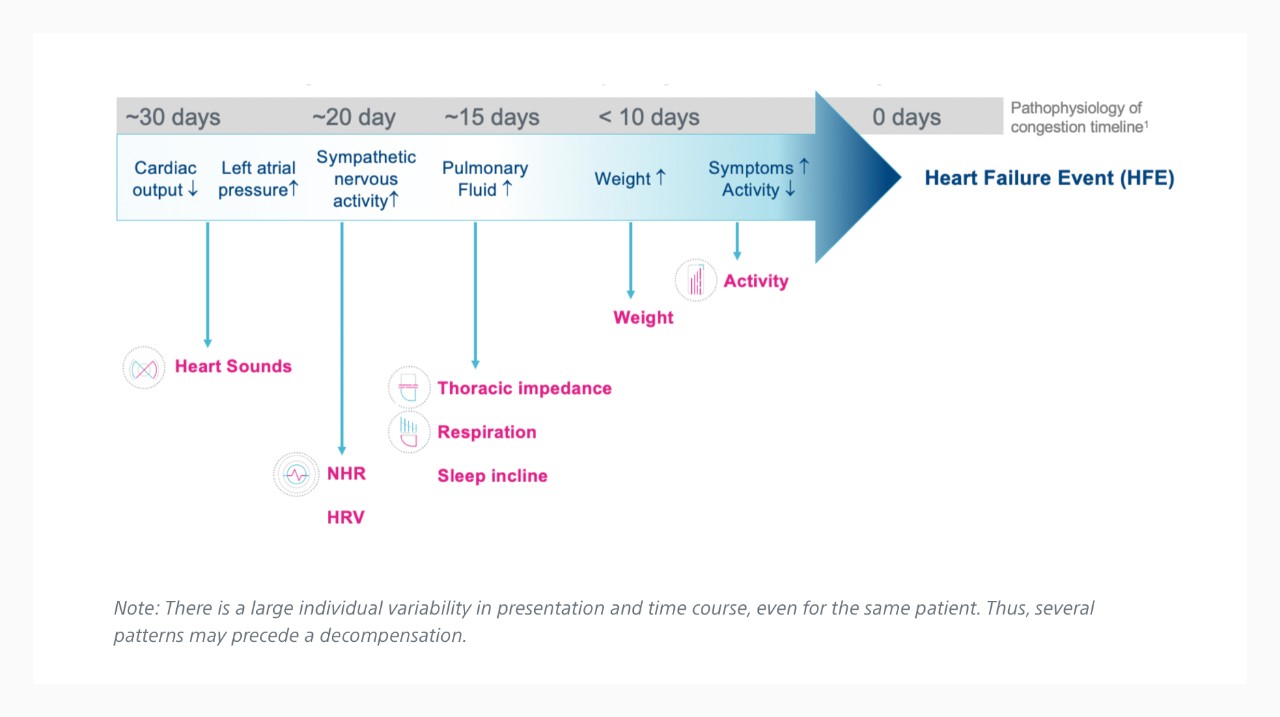
Time Course of HF Decompensation1
Emulating Clinical Assessment via Physiologic Sensor Monitoring
MultiSENSE Study Results2
The MultiSENSE study assessed more than 900 patients and validated that the HeartLogic algorithm provides a sensitive and timely predictor of impending heart failure decompensation.
MANAGE-HF Study3
Phase I of the MANAGE-HF study enrolled 200 patients implanted with a CRT-D or ICD enabled with HeartLogic. The study found that HeartLogic was safely integrated into clinical practice and associated with lower natriuretic peptide levels and hospitalization rates.4
*Compared with pre-study hospitalization rate (12 months).
Electrophysiology Insights
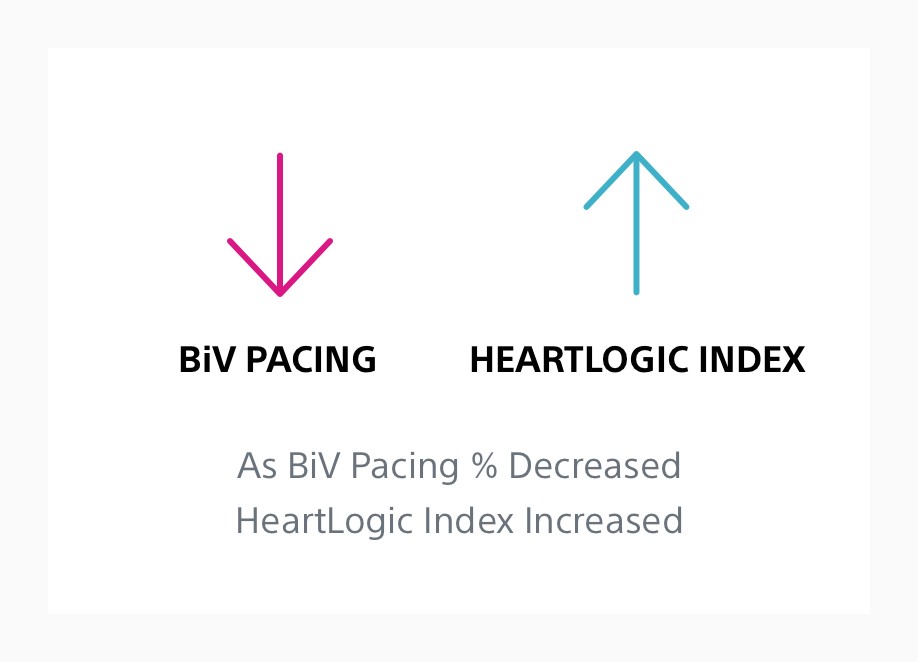
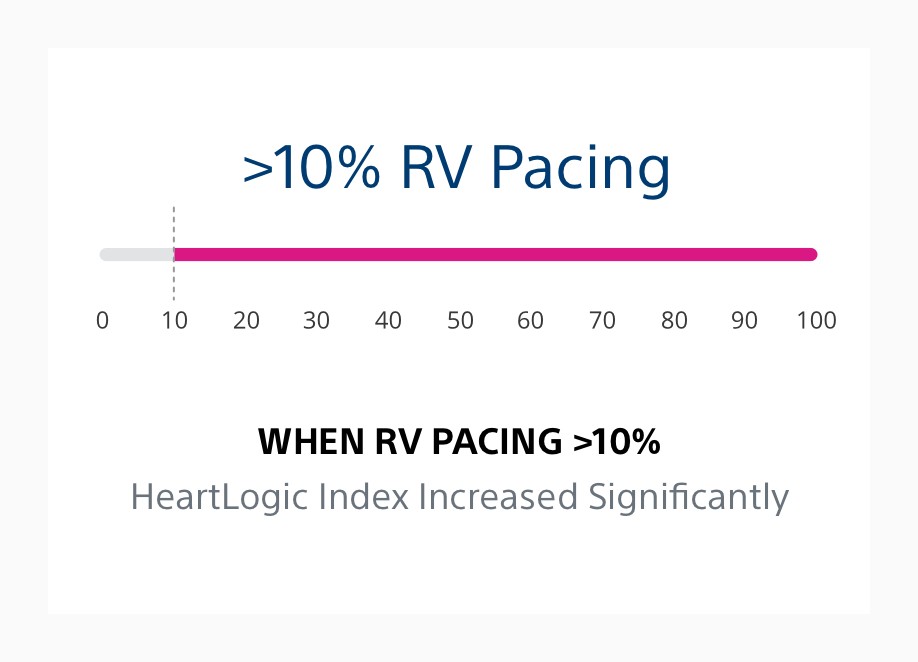
HeartLogic uses automated intelligence to streamline your ability to see each patient’s physiologic response to arrhythmic and pacing changes.
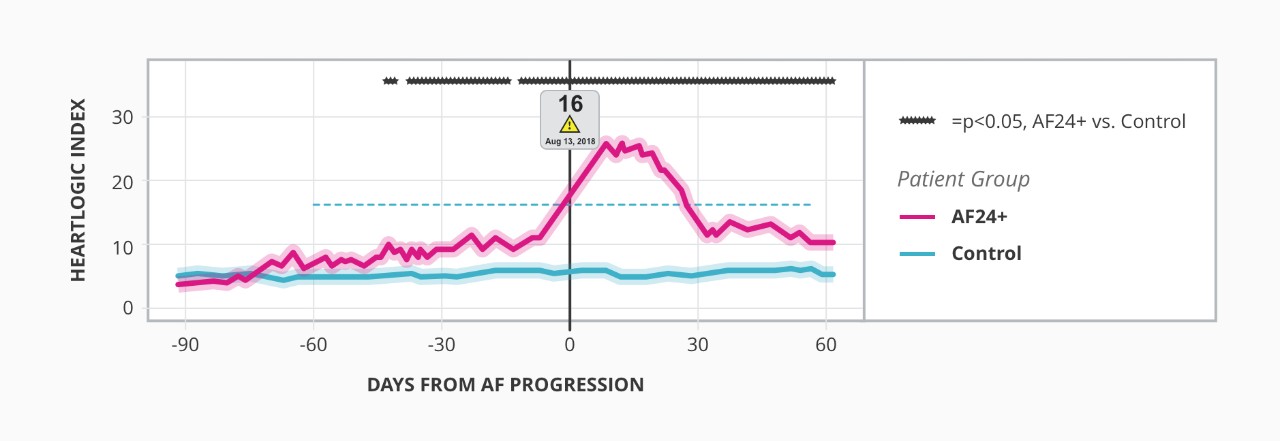
Relationship Between Atrial Fibrillation and HeartLogic Index5
Real-World Evidence
In real-world analyses of nearly 500 patients across four studies, HeartLogic was shown to provide consistent heart failure detection performance with low unexplained alert rates.
Real-World Results Compared to Validation Data Set
| MultiSENSE2 (Validation Data Set) |
Capucci et al.5 (ESC HF 2019) |
Santini et al.8 (Clin Card 2020) |
RE-HEART Phase I9 (ESC HF 2020) |
RE-HEART Phase II10 (ESC HF 2020) |
|
|---|---|---|---|---|---|
| SENSITIVITY | 70% | 100%* | 69%* | N/A | N/A |
| UNEXPLAINED ALERT RATE | 1.47 | 0.41 | 0.37 | 0.25 | 0.13 |
Highlights from Real-World Studies
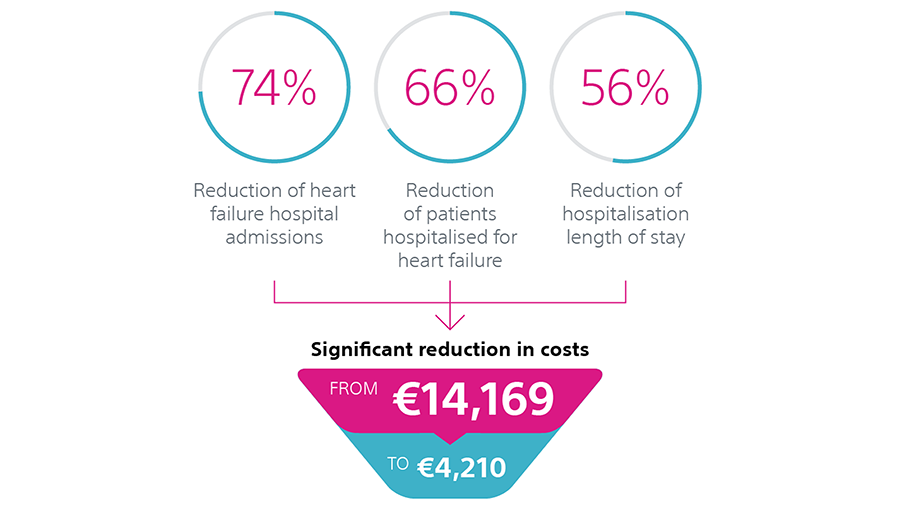
HeartLogic reduces hospitalisations for decompensated heart failure and significantly reduces the costs per patient for the healthcare system, as described in the Heggermont et al publication.11

Stay Up to Date
Sign up for periodic emails and receive a HeartLogic fact sheet to share with your patients’ care teams.

Increase Efficiencies. Improve Lives.
See how HeartLogic may help you increase clinic efficiencies, reduce hospital readmissions and improve patient outcomes.


