
")

")

")
")


")
")


Dear HeartLogic™ users,
At the end of this year full of HeartLogic™ activities and publications, we would like to give you a summary of the most relevant evidence released.
We have sorted the publications into four sections, i.e. the 2022 Hot Topics for HeartLogic™, and we have summarized their take-home messages.
2022… a year full of HeartLogic™ publication successes

HOT TOPIC #1 - HeartLogic™ Performance
Wariar et al., J Card Fail. 2022 May;28(5):756-764. Doi: 10.1016/j.cardfail.2021.11.008.
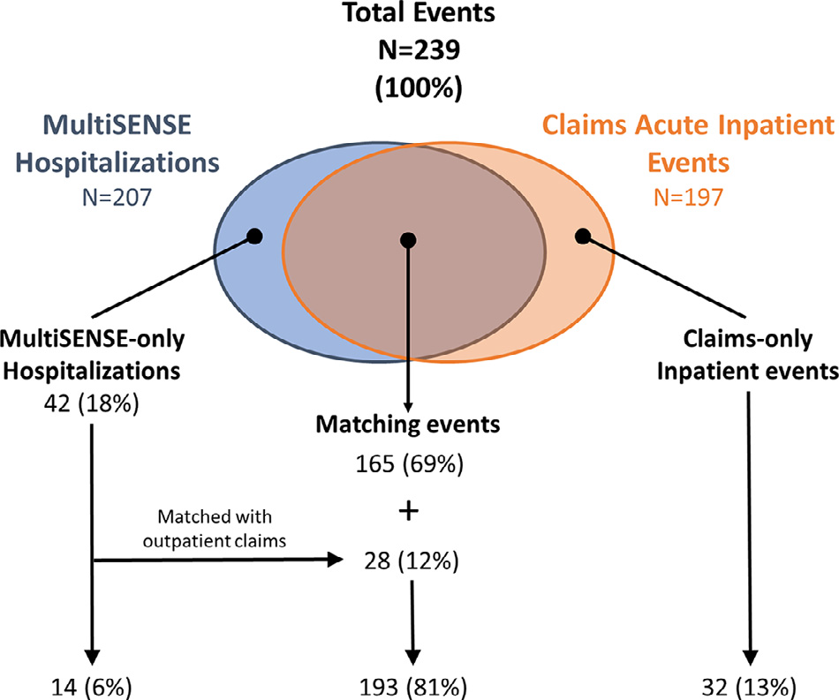
- The HeartLogic™ algorithm detected claims-derived events with a sensitivity of 75.6% and a false positive rate (FPR) of 1.539 alerts/pt-year: a substantial agreement between claims-based HF classification and study adjudication was found.
- HeartLogic™-detected events captured the majority of costs of the HF events used for diagnostic evaluation.
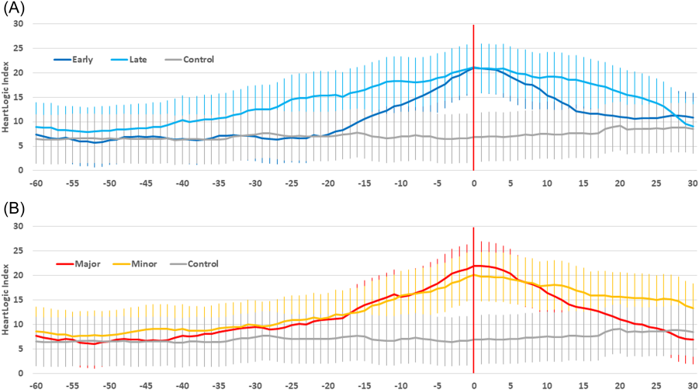
Performance of a HeartLogic™ Based Care Path in the Management of a Real-World Chronic Heart Failure Population
Feijen et al., Front Cardiovasc Med. 2022 May 6;9:883873. doi: 10.3389/fcvm.2022.883873.
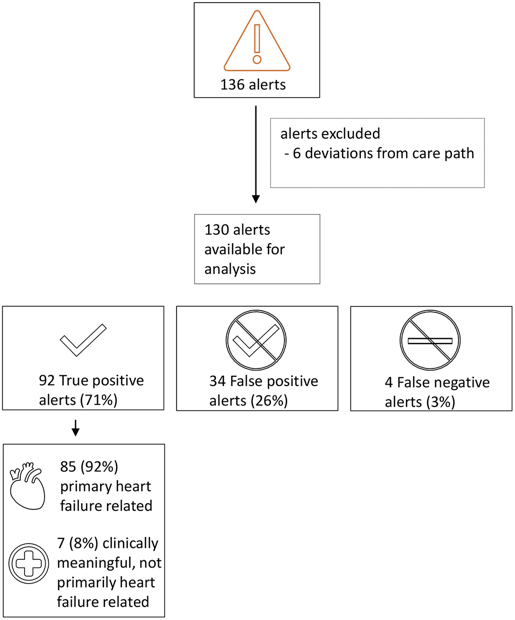
- HeartLogic™ performance:
- 79% ---> Sensitivity to detect early signs of fluid retention
- 89% ---> Specificity
- 71% ---> Positive predictive value
- 91% ---> Negative predictive value
- Higher and persistent alerts are indicative of true positive alerts and higher index values are indicative of severe fluid retention
- The HeartLogic™ algorithm facilitates early detection of impending fluid retention and thereby enables clinical action to prevent this at an early stage.
- The algorithm identifies patients at low risk of worsening heart failure ---> resources can be redirected to high-risk patients
Concurrent Assessment of the CardioMEMS™ HF System and HeartLogic™ HF Diagnostic: A Retrospective Case Series
Chilcote et al., J Card Fail. 2022 Jan;28(1):44-55. doi: 10.1016/j.cardfail.2021.07.010.
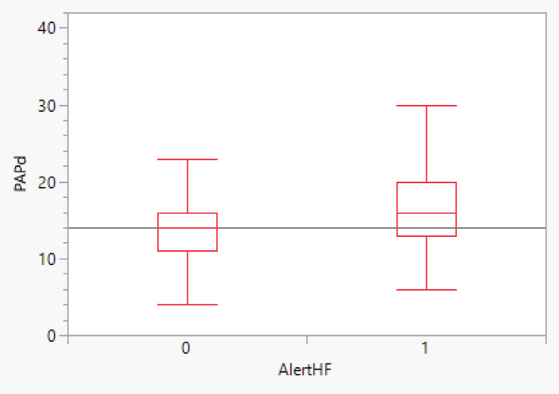
- The pulmonary artery diastolic pressure (PADP) measured with CardioMEMS™, was significantly higher during the HeartLogic alert periods versus the non-alert periods, despite a weak correlation observed between daily values of PADP and HeartLogic™ Index.
- Both PADP and HeartLogic™ seem to achieve the goal of RPM (to early identify patients at risk for HF events) by detecting increased cardiac filling pressures using two different approaches.
HOT TOPIC #2 - HeartLogic™ Alert Management
Hernandez et al., J Card Fail. 2022 Aug;28(8):1245-1254. doi: 10.1016/j.cardfail.2022.03.349.
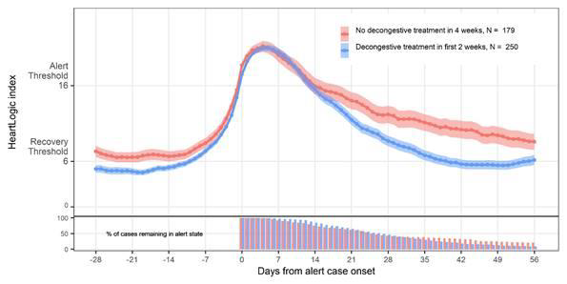
- The HeartLogic™ index and alert algorithm management were safely integrated into clinical practice and, in response to alerts, augmentation of diuretics was the principal treatment pattern.
- The HF treatment augmentation, early in response to alerts, resulting in more rapid reduction of HeartLogic™ index values.
Decongestive treatment adjustments in heart failure patients remotely monitored with a multiparametric implantable defibrillators algorithm.
Guerra et al., Clin Cardiol. 2022 Jun;45(6):670-678. doi: 10.1002/clc.23832.
- Decongestive treatment adjustments triggered by HeartLogic™ alerts seem safe and effective, even when such adjustments were completely dependent on the physicians’ clinical expertise and were not standardized.
- The early use of decongestive treatment and the use of high doses of diuretics seem to be associated with more favorable outcomes.
Heartlogic™: ready for prime time?
Heggermont et al., Expert Rev Med Devices. 2022 Feb;19(2):107-111. doi: 10.1080/17434440.2022.2038133.
- In this review of sponsored clinical trials authors highlighted that, using HeartLogic™ tool, it is possible to manage large groups of heart failure patients remotely, reliably and safely and that HeartLogic™ is able to risk stratify patients, for more efficient and effective allocation of human resources to those patients at high HF risk.
- When a patient is in alert state, it is important to explore not only potential causes of decompensation, but also look for non-HF-related major problems (thyroid disorders, pneumonia) that could eventually trigger decompensation in a multidisciplinary heart failure team.
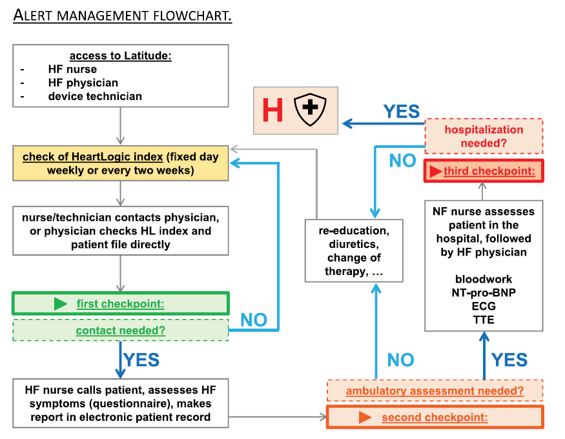
Clinical Utility of HeartLogic™, a Multiparametric Telemonitoring System, in Heart Failure
Lopez-Azor et al., Card Fail Rev. 2022 Apr 21;8:e13. doi: 10.15420/cfr.2021.35.
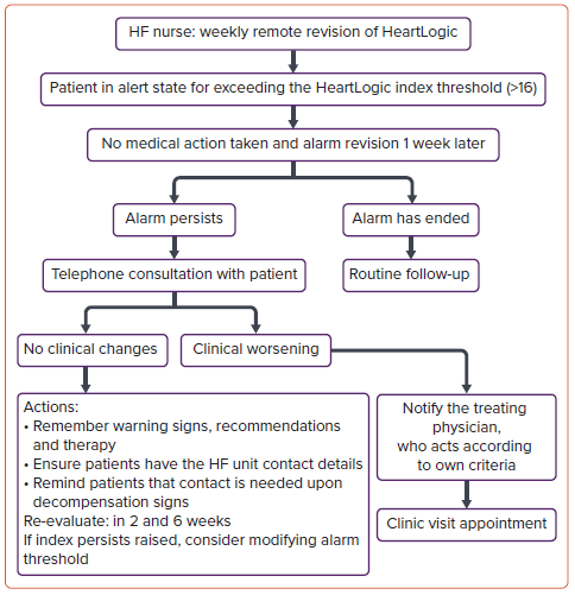
- This is a review of the most important studies that reported the performance of HeartLogic™ and of the flowcharts proposed for alerts management (i.e. RE-HEART flowchart has been reported in the figure).
- HeartLogic™ seems to be a useful tool in the daily practice of an HF program to identify patients at increased risk of decompensation, to enable prompt action to avoid an impending decompensation. This proactive way of following patients is promising and will hopefully lead to improvements in the prognosis of HF.
- Most patients can be managed by telephone, thus avoiding unnecessary visits to the clinic, improving patient experience.
HOT TOPIC #3 - HeartLogic™ and Atrial Fibrillation
Bertini et al., Heart Rhythm. 2022 May;19(5):790-797. doi: 10.1016/j.hrthm.2022.01.020.
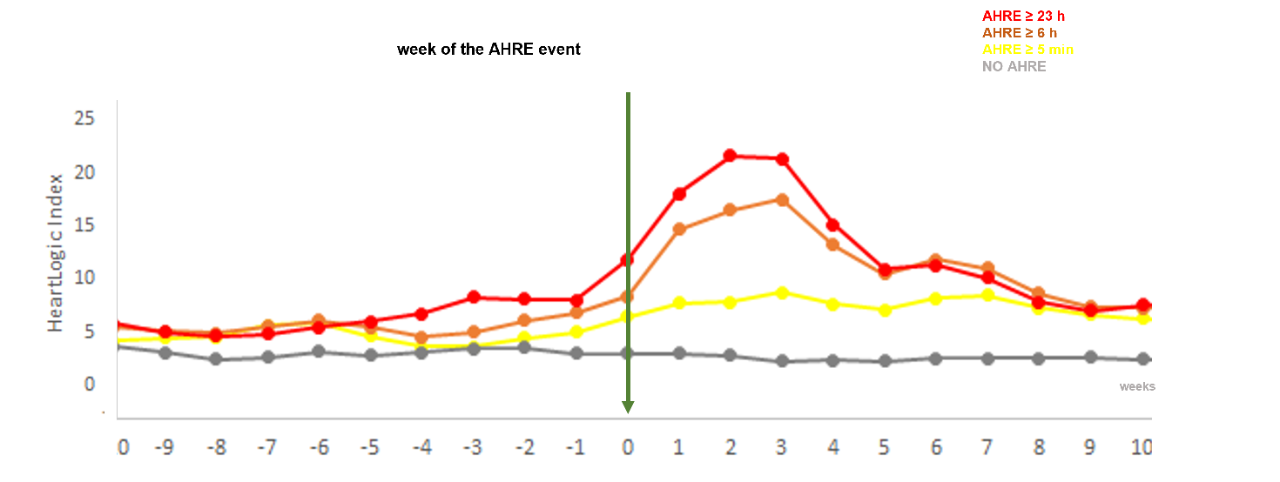
- The HeartLogic™ alert state was independently associated with AHRE events.
- The HeartLogic™ IN-alert state during follow-up identified patients who were from two- to more than three-fold more likely to experience an AHRE episode, according to various thresholds of daily AF burden.
Temporal Association of Atrial Fibrillation With Cardiac Implanted Electronic Device Detected Heart Failure Status
Capucci et al., JACC Clin Electrophysiol. 2022 Feb;8(2):182-193. doi: 10.1016/j.jacep.2021.09.015.
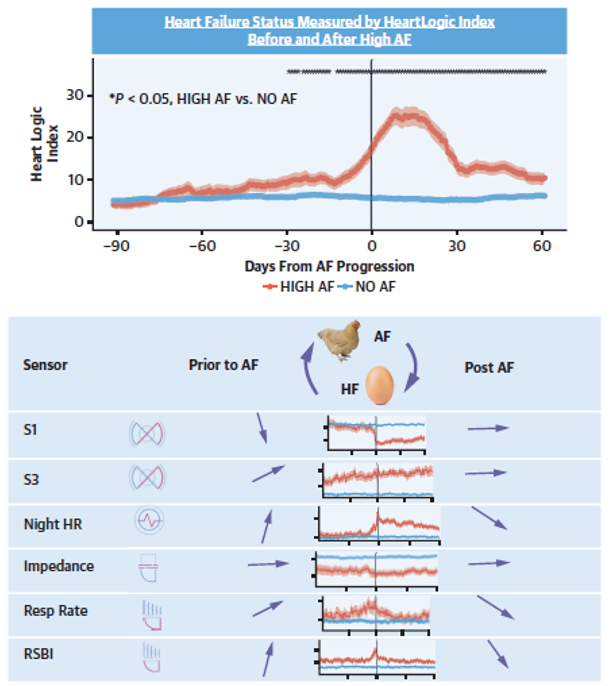
- Worsening of HF status, as indicated by device-based sensors, preceded AF onset.
- HF status worsened further after AF with an increased risk of HF acute events following AF.
These findings suggest the bidirectional interaction between AF and HF and also the role of progressive HF worsening as a possible cause of AF that further impairs cardiac function.
HOT TOPIC #4 - HeartLogic™ and Covid
Ziacchi et al., Biology (Basel). 2022 Jan 12;11(1):120. doi: 10.3390/biology11010120.
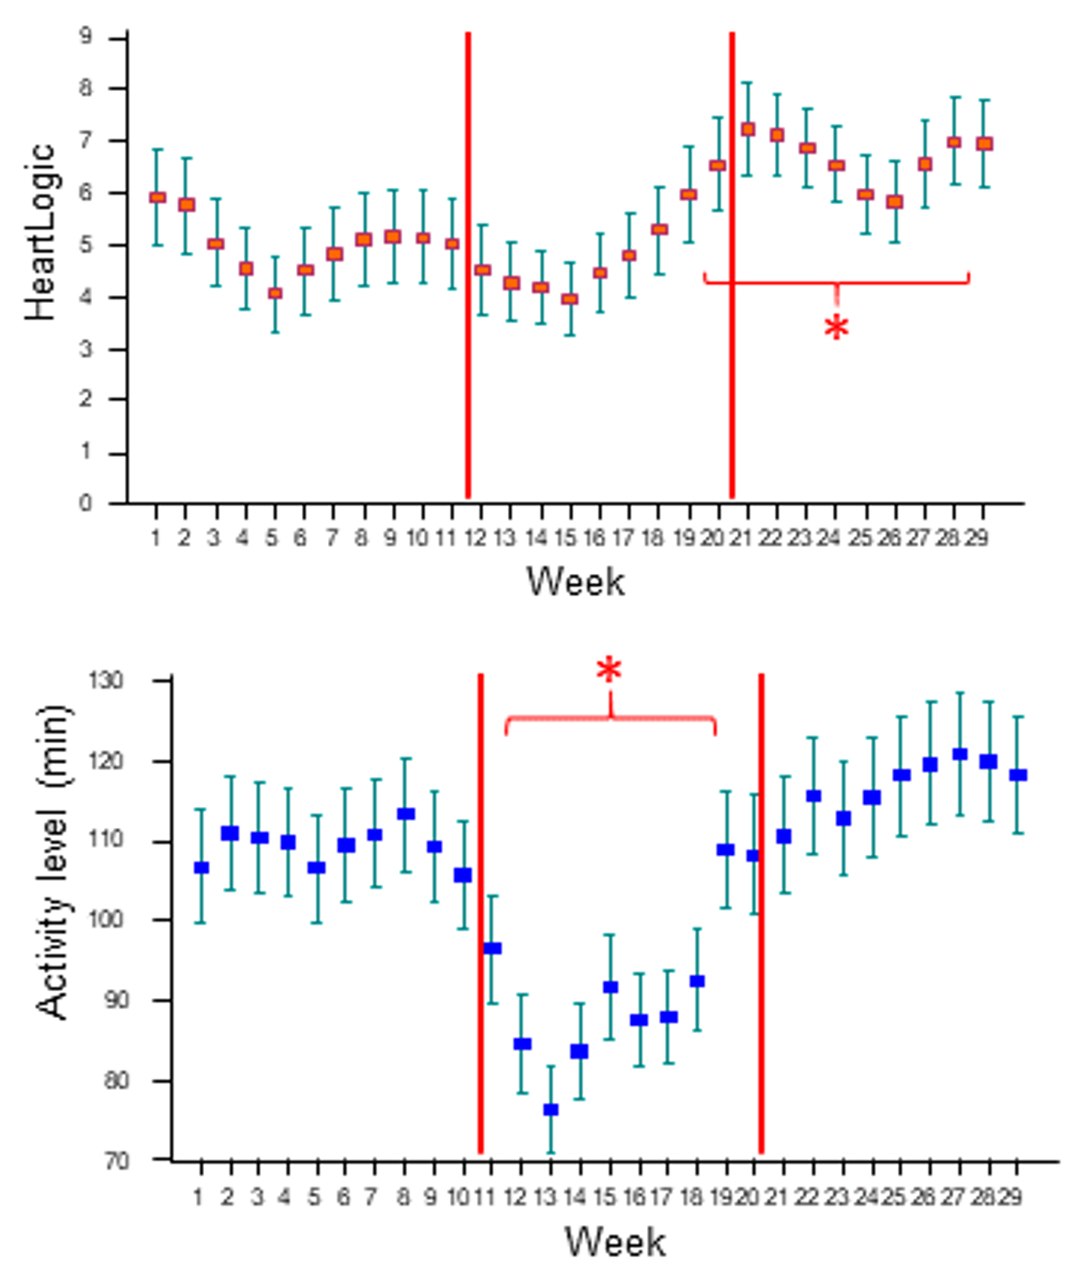
- The system was sensitive to the behavioral changes that occurred during the lockdown, i.e. decrease in activity. However, the home confinement had no impact on the other sensors.
- The higher rate of HeartLogic™ alerts during the lockdown and the increase in the median index after 8 weeks of home confinement suggest the worsening of the HF-status, possibly explained by the behavioral changes. Nonetheless, the management of the HF detected events (actions performed and management strategy) was not impacted by the restrictions.
Detecting early physiologic changes through cardiac implantable electronic device data among patients with COVID-19
Turchioe et al., Cardiovasc Digit Health J. 2022 Oct;3(5):247-255. doi: 10.1016/j.cvdhj.2022.07.070.
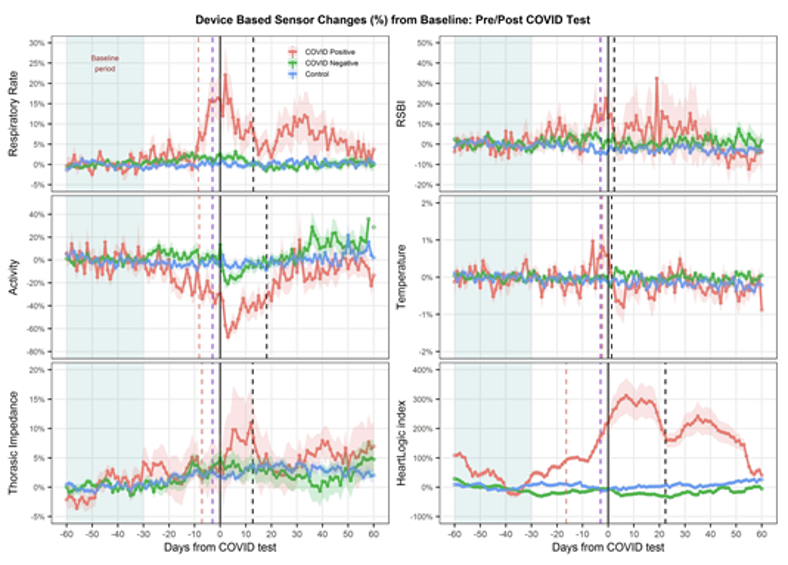
- In COVID- positive patients, respiratory rate, activity, and HeartLogic™ Index deviated from baseline approximately seven days before symptom onset and testing, and respiratory rate during the week before testing predicted a positive test.
- The HeartLogic™ and sensors changes provide early evidence of the power of remote monitoring with CIEDs for the early detection of physiologic changes that may be subtle and may precede clinical symptoms.
- The continuous longitudinal measures of CIED sensors trends highlighted prolonged post-COVID recovery and may be a powerful tool in characterizing true cardiac injury or exacerbation of underlying cardiopulmonary status resulting from the infection.