
")

")

")
")


")
")


Dear HeartLogic™ users,
We hope this newsletter finds you well after the summer break and ready for a new year.
In this newsletter we will present two recently published papers on HeartLogic™: a case series about HeartLogic™ and CardioMEMS™ and an analysis of the sensors trends in patients with COVID-19.
Finally, we will share with you the latest findings presented during ESC congress in Barcelona.
HeartLogic™ and CardioMEMS™
As known, the use of remote patient monitoring is expected to improve the outcome of HF patients, by reducing HF hospitalization recurrence. Among RPM-capable devices currently used in clinical practice, the CardioMEMS™ HF system (CMEMS) allows wireless pulmonary artery pressure monitoring, and HeartLogic™ HF Diagnostic combines multiple ICD sensors into a composite index.
Recently, Chilcote et al. (Prisma Health-Upstate, Greenville, South Carolina) published in the Journal of Cardiac Failure (https://doi.org/10.1016/j.cardfail.2021.07.010) an analysis of the concurrent monitoring of pulmonary artery diastolic pressure (PADP) with the CMEMS device and the use of HeartLogic™ index. They analysed clinical events, measurements availability and compliance, and device associations over at least 12 months.
Concurrent Assessment of the CardioMEMS™ HF System and HeartLogic™ HF Diagnostic: A Retrospective Case Series
To date, only case reports were published on patients who received CardioMEMS™ and HeartLogic™ and long-term data on the correlation between the information provided by the two tools was not available.
The aim of this analysis was to detail the concurrent monitoring of patients with CMEMS and HeartLogic™ and describe hospitalizations, HF hospitalizations, HF-related visits, and pulmonary artery pressure actions.
From 2017 to 2021, 7 patients were implanted with CMEMS and a HeartLogic™-enabled device and had at least 12 months of follow-up data.
The RPM program for HF was managed by a physician and nurse who provided individualized monitoring and alert-specific medication changes based on RPM data available at that time. Each CMEMS participant had an individualized PADP goal of ±4 mm Hg, indicating an euvolemic range.
Each case was detailed in terms of HeartLogic™ index changes and alerts, CMEMS adherence and actions, PADP values at the time of hospitalizations (both HF and not), outpatient visits, and therapy changes.
Results:
Overall, the main findings are:
- During a median study period of 1.44 years per participant, they recorded:
- Data availability was significantly higher for HeartLogic™ (99.6%) compared with adherence for CMEMS (64.1%; p=0.016)
- PADP was significantly associated with HeartLogic™ Index (βHL = 0.052 mm Hg/HL Index, P = 0.045), but the correlation coefficient was weak (r = 0.098). In 2 participants, there was a moderate correlation between HeartLogic™ Index and PADP.
- 22 hospitalizations (3 HF hospitalizations)
- 17 HF-related outpatient visits
- 46 pulmonary artery pressure actions
- 15 PADP goal changes
- Figure 1 shows that PADP was 2.87 mm Hg higher (P = 0.014) during HeartLogic™ alert periods (AlertHF = 1) compared with non-alert periods (AlertHF = 0) (observed mean difference = 3.05 mm Hg)
- 23% of the available PADP measurements were above a PADP goal by 4 mm Hg during an HeartLogic™ alert, compared with 13% when out of alert.
The estimated odds of being in a higher PADP goal were 4.7 times higher (95% confidence interval 3.0 - 7.2, P < 0.001) during HL alert periods compared with non-alert periods.

Conclusions:
- The PADP was significantly higher during the HeartLogic™ alert periods versus the non-alert periods, despite a weak correlation observed between daily values of PADP and HeartLogic™ Index.
- A greater proportion of PADP measurements were above goal during the HeartLogic™ alert periods versus the non-alert periods.
- Both PADP and HeartLogic™ seem to achieve the goal of RPM (to early identify patients at risk for HF events) by detecting increased cardiac filling pressures using two different approaches
Key differences:
1. the PADP is a single sensor measurement whereas the HeartLogic™ Index is a multisensor composite.
2. the HeartLogic™ Index is derived from unidirectional changes in sensor measurements from a baseline designed to detect worsening HF, whereas the PADP is a bidirectional absolute measure.
3. PADP is taken at a single point in time, whereas the HeartLogic™ Index is derived by averaging multiple measurements throughout the day
HeartLogicTM sensors changes in COVID-19 patients
An analysis of the HeartLogic™ sensor changes in patients with COVID-19 infection has been published by Dr. MR Turchioe et al. (Weill Cornell Medicine, NY) in the Cardiovascular Digital Health Journal (https://doi.org/10.1016/j.cvdhj.2022.07.070)
Detecting early physiologic changes through cardiac implantable electronic device data among patients with COVID-19
Many studies have well-described broad effects of COVID-19 on the cardiac and respiratory systems, so it is possible that certain CIED sensors may also detect a COVID-19 infection, potentially before symptom onset.
HeartLogic™ algorithm combines data from multiple ICD‐ and CRT‐D‐based sensors, including heart sounds, respiratory rate, thoracic impedance, heart rate, and activity level, so it could be a powerful tool to identify early signs of COVID-19 infection.
The aim of this study was to evaluate early physiologic changes associated with the onset of acute COVID- 19 infection, as well as during and post-acute infection, among patients with CIEDs.
All patients who had an actively transmitting Boston Scientific CIED during the study period were eligible for inclusion. To account for possible testing bias, three cohorts of patients were created using COVID-19 test date and status documented in the institutional COVID-19 repositories:
1. patients with a positive COVID-19 test (“COVID-positive”)
2. patients with a temporally concordant negative COVID-19 test (“COVID-negative”)
3. patients who did not have a COVID-19 test (“control").
Results:
- Among 2.210 patients that met eligibility criteria, 286 were suitable for the analysis:
- 20 COVID-positive group
- 166 COVID-negative group
- 100 CONTROL group, randomly selected from the pool of patients without a COVID-19 test. - Figure 1 shows the average sensor changes from 60 days prior through 60 days following COVID-19 testing, in COVID-positive (red line), COVID-negative (green line), and control (blue line) patient cohorts.
Observing the vertical lines (legend in Figure 1), it can be noticed that for COVID-positive patients, several sensors (respiratory rate, activity, thoracic impedance, and HeartLogic™ Index) significantly changed from baseline several days prior to symptom onset and remained significantly changed (from baseline) for several days or weeks after COVID-19 testing.

- The comparison of the number of days before COVID-19 testing showed that the sensors changed sooner for COVID-positive compared to COVID-negative patients: HeartLogic™ Index (mean 16.4 vs. 9.2 days; p=0.08), respiratory rate (mean 8.5 vs. 3.9 days; p=0.01), activity (mean 8.2 vs. 3.5 days; p=0.008), and temperature (mean 2.3 vs. 1.0 days; p=0.08).
- The multivariable logistic regression models (Table 1) confirmed that, during the seven days before COVID-19 testing, the respiratory rate significantly predicted a positive COVID-19 test (OR: 2.31 [95% CI 1.33-5.13]), after adjustment for baseline characteristics that differ in three cohorts.

Conclusions:
- In COVID- positive patients, respiratory rate, activity, and HeartLogic™ Index deviated from baseline approximately seven days before symptom onset and testing, and respiratory rate during the week before testing predicted a positive test.
- These findings provide early evidence of the power of remote monitoring with CIEDs for the early detection of physiologic changes that may be subtle and may precede clinical symptoms.
- The continuous longitudinal measures of CIED sensors trends highlighted prolonged post-COVID recovery and may be a powerful tool in characterizing true cardiac injury or exacerbation of underlying cardiopulmonary status resulting from the infection.
ESC Congress 2022
The annual congress of the European Society of Cardiology took place on 26 – 29 August in Barcelona and Online.
This year the Congress celebrated 70 years since the first ESC Congress!
Many scientific presentations, symposia, tech suite, debates and more were presented by leading experts covering a wide spectrum of cardiology therapies.

Live Abstract Session
Dr. Feijen from Leiden University Medical Center presented:
Activation of the HeartLogic™ algorithm on top of heart failure care: a multicenter propensity-matched cohort analysis.
The aim of this analysis was to investigate the effects of activating HeartLogic™ on top of heart failure care with telemonitoring on the number of HF episodes with fluid retention and heart failure-related hospitalizations.
From January 2017 until December 2020, 127 patients with HeartLogic™ activated CIED were included and matched with 127 heart failure patients with a CIED on routine telemonitoring at 4 centers.
Patients were followed up for 365 days and data of all episodes of (impending) fluid retention with ≥2 signs and symptoms of congestion were considered for analysis.
During the follow-up period of 254 patient years:
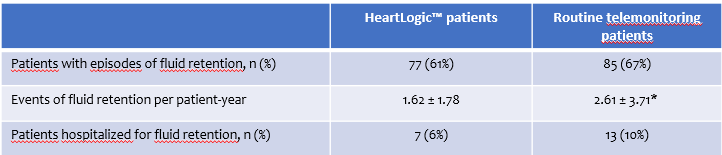

Conclusions:
In a real-world multicenter heart failure population, activation of the HeartLogic™ algorithm was associated with
-a lower number of episodes of fluid retention per patient
-a shorter duration of hospitalizations for congestive heart failure.
Moderated e-Posters Session
In these sessions, three e-Poster on HeartLogic™ have been presented.
Dr. Compagnucci et al, presented “Implantable defibrillator-detected heart failure status predicts ventricular tachyarrhythmias”, an analysis of the association between HeartLogic™ Index and ventricular tachyarrhythmias (shocks and anti-tachycardia pacing).

Conclusions: The HeartLogic™ index is an independent dynamic predictor of appropriate defibrillator therapies. The combined index and its individual physiological components change before the arrhythmic event occurs.
Dr. Garcia et al., presented “Evaluation of a multisensory algorithm to prevent acute decompensation of heart failure in patients implanted with a cardioverter defibrillator: rationale and design”, the design of the new HeartLogic™ French Study.

Conclusions: The HeartLogic™ French Cohort Study will provide robust real-world data on HF hospitalization in a cohort of patients managed with the HeartLogic™ algorithm allowing preemptive treatment of congestion.
Dr. Santobuono et al, presented “Performance of a multisensor implantable defibrillator algorithm for HF monitoring in presence of comorbidities”, an analysis of the performance of HeartLogic™ in non-CRT patients, as well as in relation to the presence of comorbidities.

[This analysis has been previously presented at EHRA Congress. For more details refer to the HeartLogic Newsletter #3_2022.]