
")

")

")
")


")
")


Dear HeartLogic™ users,
First of all, we would like to wish you and your patients a wonderful new year!
We are confident that 2022 will be rich of new evidence and publications on HeartLogic, which we will take care to share and comment on with you.
We are very pleased to include in this first HeartLogic Newsletter of 2022 two new interesting papers about the use of HeartLogic in clinical practice and its diagnostic performance.
Moreover, you can find, as usual, a new case of the month.
HeartLogic and Covid-19 Lockdown
An analysis of HeartLogic performance during Italian lockdown caused by Covid-19 pandemic has been published by Dr. Ziacchi (Sant’Orsola Hospital, Bologna, Italy) in Biology Journal as part of the Special Issue “Biophysics Arrhythmias and Pacing”:
Implantable Cardioverter Defibrillator Multisensor Monitoring during Home Confinement Caused by the COVID-19 Pandemic
The home confinement for the COVID-19 pandemic in Italy was imposed from March 8th to May 18th 2020. The first 29 weeks of the year were considered as observation period, from January 1st to July 19th, and they were divided period in 3 phases:
- Pre-Lockdown (weeks 1-11)
- Lockdown (weeks 12-20)
- Post-Lockdown (weeks 21-29).
The primary objectives of this analysis were:
- to examine whether the HeartLogic may elucidate behavioral changes that impact HF decompensation
- to examine possible consequences of home confinement caused by the COVID-19 pandemic
349 ICD and cardiac resynchronization therapy ICD patients in 20 Italian centers were included in the analysis.
Results:
The HeartLogic index crossed the threshold value 35 times in the Pre-Lockdown phase, 49 times during the Lockdown phase (incidence rate ratio 1.71 [95% CI: 1.09-2.72] versus Pre-Lockdown; p=0.014), and 43 times during the Post-Lockdown phase (incidence rate ratio 1.50 [95% CI: 0.94-2.42] versus Pre-Lockdown; p=0.072).
The proportion of alerts managed remotely, as well as the proportion of alerts triggering clinical actions remained constant among study phases (Table 1).
| Alerts, n | Rate [95% CI], Alerts/100pt-weeks | Alert duration,Days | Maximum Index Value | Alerts with actions | Remote management |
Pre-lockdown | 35 | 0.91 [0.64-1.27] | 47 [29-60] | 28 ± 11 | 11 (31%) | 31 (89%) |
Lockdown | 49 | 1.56 [1.15-2.06] | 39 [28-57] | 30 ± 15 | 11 (22%) | 44 (90%) |
After-lockdown | 43 | 1.37 [0.99-1.84] | 36 25-57] | 24 ± 12 | 12 (28%) | 38 (88%) |
Sensor Trends Analysis
The analysis of HeartLogic and contributing trends immediately after stay at home orders showed that:
- There was a significant drop in the activity level (65min [36-103] in week 12 vs. 101min [61-140] in Pre-Lockdown; p<0.001);
- There was no difference in the other contributing sensors.
The composite HeartLogic index significantly increased at the end of Lockdown phase (from week 20), and the increase in the average index remained significant until week 28 in the Post-Lockdown phase. The median composite HeartLogic index increased at the end of Lockdown (4.7 [1.3-10.2] in week 20 vs. 2.5 [0.7-7.0] in Pre-Lockdown; p=0.019).
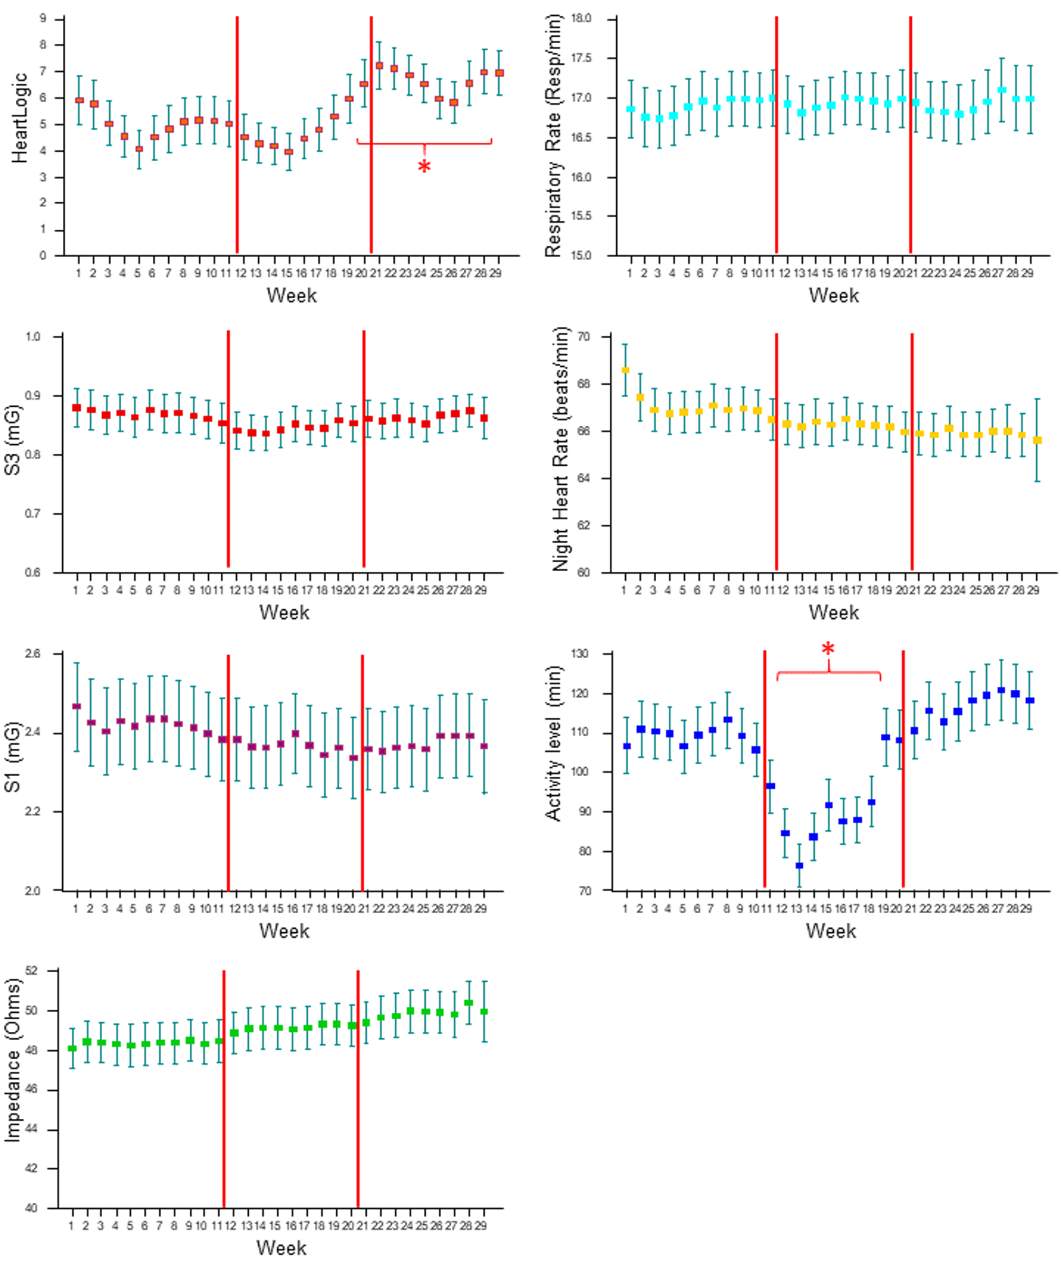
On comparing the trends of all physiologic parameters among study phases, we noticed similar values, i.e. comparable contribution from all sensors to the combined HeartLogic index, except for higher activity levels before and after the alert onset in the Post-Lockdown phase than in the other phases.
Conclusions:
- The system was sensitive to the behavioral changes that occurred during the lockdown, i.e. decrease in activity. However, the home confinement had no impact on the other sensors.
- The higher rate of HeartLogic alerts during lockdown and the increase in the median index after 8 weeks of home confinement suggest the worsening of the HF status, possibly explained by the behavioral changes. Nonetheless, the management of the HF detected events (actions performed and management strategy) was not impacted by the restrictions.
MultiSENSE Analysis
A new paper from the MultiSENSE Study has been recently published by Ramesh Wariar et al. on Journal of Cardiac Failure, https://doi.org/10.1016/j.cardfail.2021.11.008
Evaluation of Medicare Claims for the Development of Heart Failure Diagnostics
The MultiSENSE trial was conducted to develop a multiparameter implantable device index (HeartLogic) for the detection of worsening HF. The validation of the HeartLogic has been performed through the adjudication of HF events performed by a Clinical Events Committee (CEC), but this method is time consuming, resource intensive and expensive.
In this paper, data from the MultiSENSE study were linked with Medicare claims data in order to:
- Assess agreement of deaths and HF hospitalizations based on claims-diagnostic codes with study event adjudication;
- Evaluate HeartLogic diagnostic performance using claims data;
- Estimate costs of HeartLogic-detected HF events.
The authors compared death and hospitalization events adjudicated in the MultiSENSE study with claims data.
Deaths were obtained from the Medicare beneficiary summary file, while inpatient, outpatient and physician/carrier claims files were used to obtain inpatient and outpatient event dates, primary diagnosis codes (DRG and ICD-9-CM), and costs.
Results:
Among the 900 patients enrolled in the MultiSENSE study, 320 were identified with continuous Medicare fee-for-service (FFS) coverage during study participation and were included in the analysis. The average follow-up duration was 0.94 years.
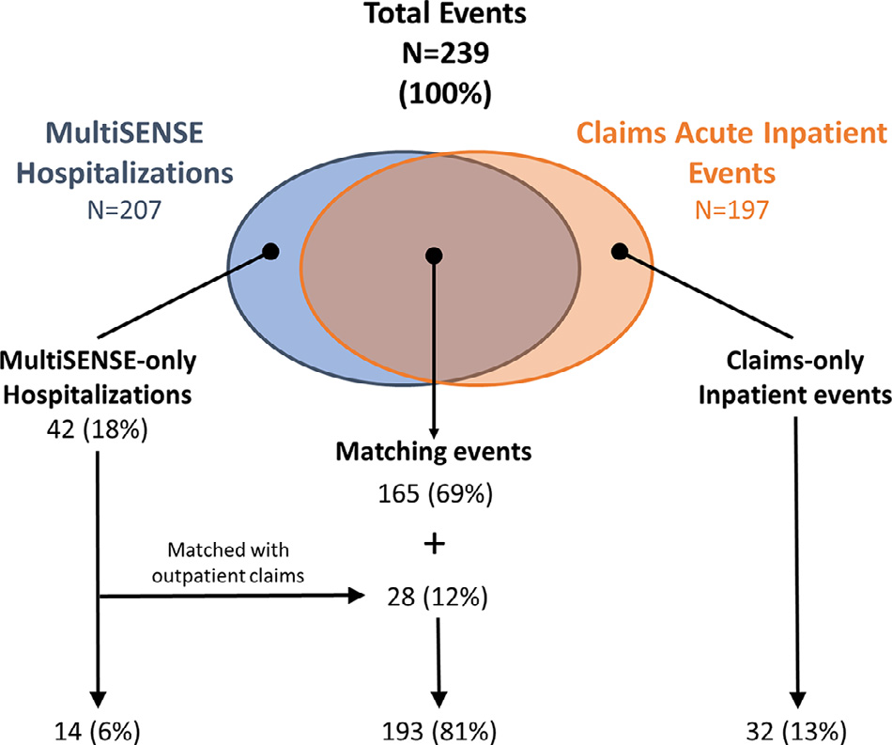
- MultiSENSE and claims deaths matched exactly (n=14)
- 193 MultiSENSE hospitalization matched with claims data (81%). Details are reported in Figure 2.
In the 165 MultiSENSE hospitalizations that matched with inpatient claims, claims-based primary HF classification had an observed agreement of 93.3% with CEC-adjudicated HF and a k = 0.823 (95% CI 0.723, 0.923).
The HeartLogic algorithm detected claims-derived events with a sensitivity of 75.6% and a false positive rate (FPR) of 1.539 alerts/pt-year, which was not different from performance derived using study events (sensitivity = 77.6% and FPR = 1.528, P = 0.82 and 0.92).
The availability of claims data about costs of care, can aid diagnostic development and economic analysis.
Patients with 2 or more HeartLogic alerts during the study follow-up (37.5%) incurred 83.6% of HF inpatient costs and 66.4% of non-HF inpatient costs.
In this analysis, HeartLogic-detected events contributed to > 90% of the HFE costs used for evaluation.
Conclusions:
- A substantial agreement between claims-based HF classification and study adjudication was found.
- HeartLogic diagnostic performance using claims-derived HF events was not different from that using study CEC adjudicated events.
- HeartLogic-detected events captured the majority of costs of the HF events used for diagnostic evaluation.
Case of the month
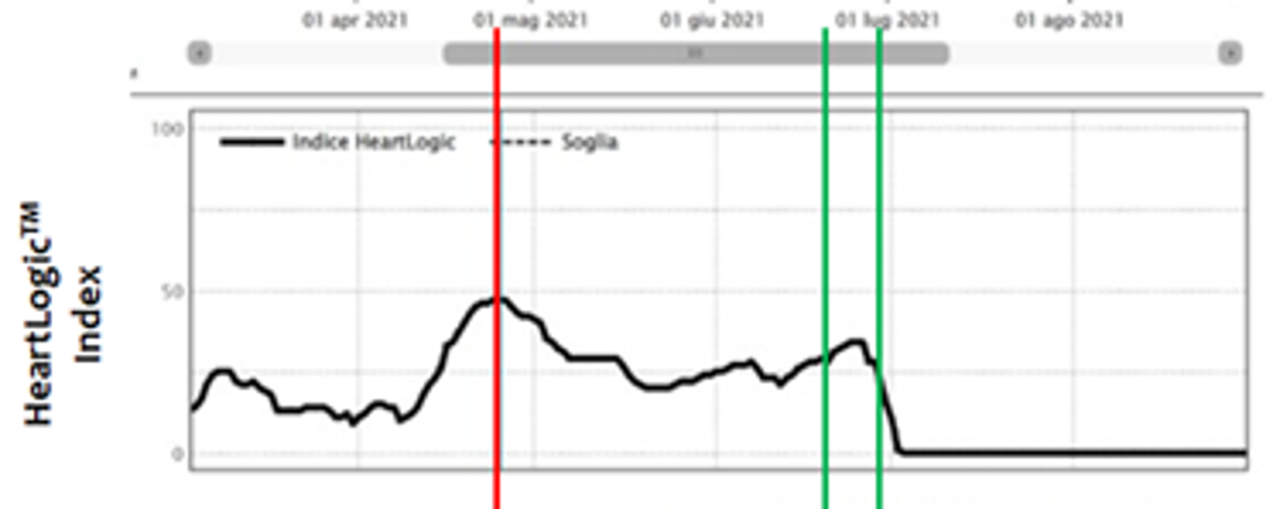
A 58-year old man with dilated cardiomyopathy and 25% LVEF, diabetes mellitus type II, moderated chronic kidney disease, arteriopathy and optimized drug therapy, underwent a Vigilant EL single-chamber ICD implantation in March 2019.
HeartLogic™ diagnostic algorithm has been activated later in September 2021…