
")

")

")
")


")
")


Dear HeartLogic™ users,
Just few weeks ago, ESC Heart Failure 2021 Congress - the largest heart failure congress in the world - took place online and on demand.The three-days event included lectures, debates on live cases, practical workshops and scientific abstract presentations about all aspects of heart failure management.
This month we would like to share with you the new clinical evidence on HeartLogic through 3 abstract presentations and 1 ePoster.
Moreover, it is our pleasure to share with you a new full paper on HeartLogic performance in COVID-19 patients published in June on ESC-HF Journal.
Heart Failure Congress 2021
The Heart Failure 2021 Congress took place online between June 29th and July 1st.
For the first time the new ESC Heart Failure Guidelines 2021 – pharmacological treatments, that will be fully released during the ESC Congress in August, have been presented by the chairs of the task force. In addition, there were also many sessions on heart failure patient management and diagnosis.
Below few summaries of the HeartLogic abstracts presented during the Congress.

Live Presentations
Multiple cardiac sensors for management of heart failure (MANAGE-HF) – Phase I
Dr. Adrian F. Hernandez – Duke Clinical Research Institute, Duke University School of Medicine, Durham, NC, USA
MANAGE-HF is a multi-center, global, prospective, open-label, multi-phase trial.
The Phase I was a non-randomized study of heart failure patients with reduced EF (≤ 35%), implanted with a CRT-D or ICD with HeartLogic. The aim of the study was evaluating HeartLogic performance, measuring and describing changes in medical treatment, natriuretic peptide levels, heart failure hospitalization rate, and safety.
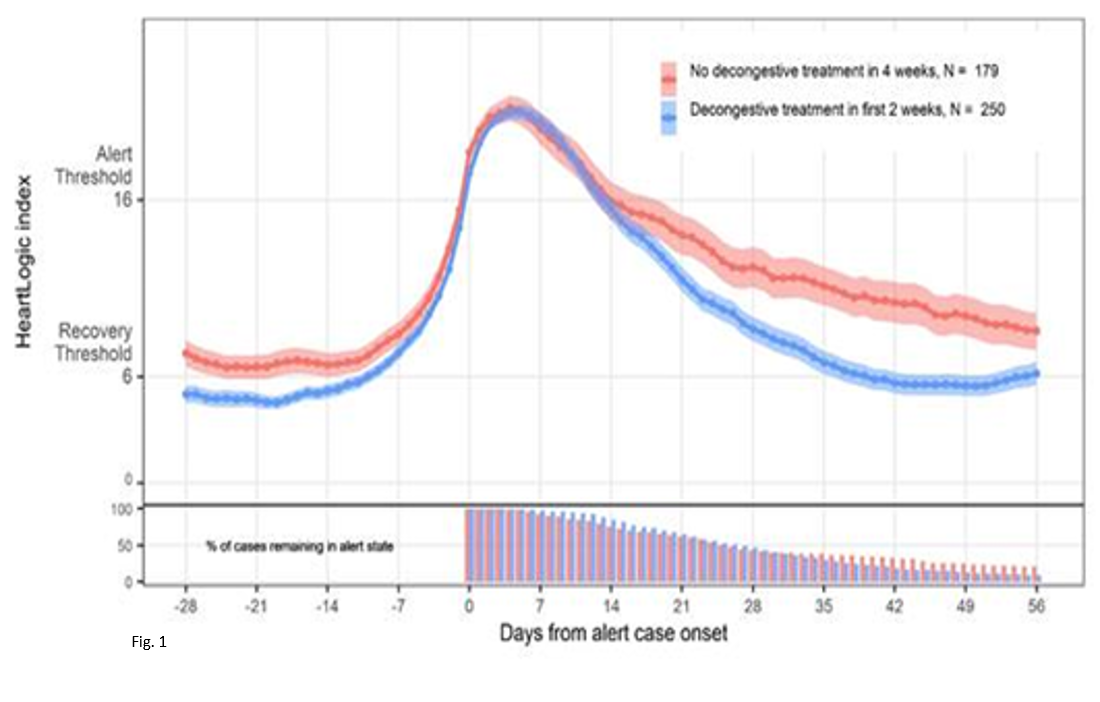
200 patients from 31 centers were included in this analysis: during a cumulative follow-up period of 333 patient years, 585 alerts occurred with an average of 1.76 alert/pt-year.
HF medications augmented in correlation to pre-alert dose during 1790 (54%) of weekly alerts: the most frequent adjustments were diuretic (89%).
Heart Failure treatment augmentation was associated with more rapid recovery of the HeartLogic index compared to patients with no change in treatment following an alert. (Fig. 1)
NTpro-BNP levels decreased from median 1316 pg/mL at baseline to 743 pg/mL at 12 months (p<0.001).
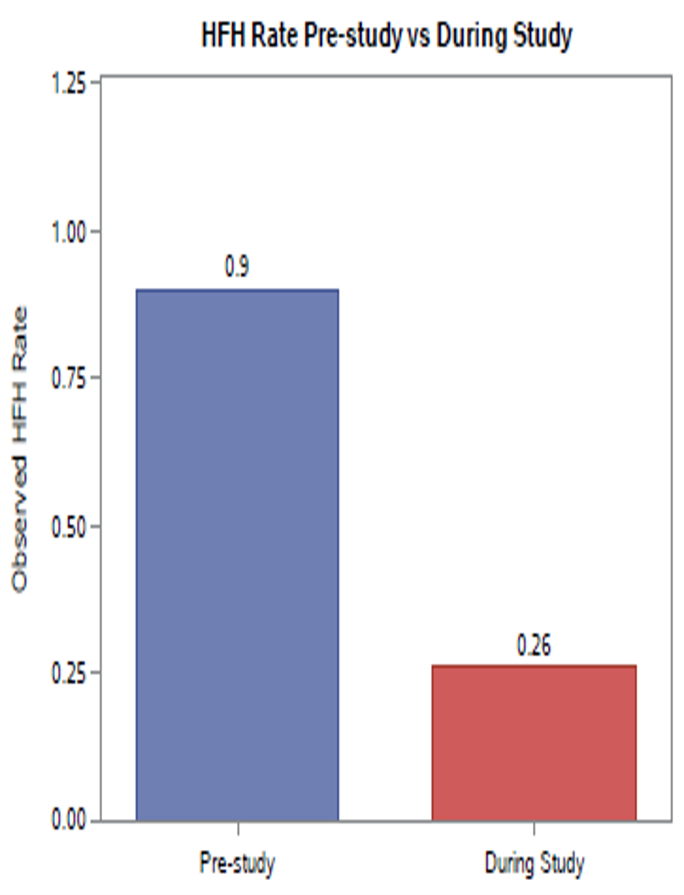
The rate of heart failure hospitalizations during study was 67% lower (rate ratio [95% CI]: 0.33 [0.23, 0.47]) compared to pre-study 12-month rate (Fig. 2).
During Phase I of the MANAGE-HF study, HeartLogic was integrated into clinical care safely and was associated with improvement in HF management.
Comparison of a multisensory ICD algorithm and NT-proBNP for Heart Failure event detection
Dr. J. De Juan Baguda – University Hospital 12 De Octubre, Madrid, Spain
The analysis, from the RE-HEART Registry enrolled 288 patients in 15 Spanish centers, compared the diagnostic accuracy of HeartLogic and NT-proBNP to detect acute decompensated HF.
NT-proBNP tests were conducted on outpatient visits or hospitalizations. According to ESC guidelines, values < 300 pg/ml were considered for the exclusion of acute decompensated HF. HeartLogic was considered as a binary index according to its IN or OUT of alert status at the time of visits and events were classified as HF or non-HF based on the in-office assessments or the admission diagnosis.
During a follow-up of 16 [95% CI: 15–22] months, 194 NT-proBNP measures were collected and 32 were associated with an HF event.
NT-proBNP value > 300pg/ml detected HF Events with:
- 100% of sensitivity
- 12% of specificity
NT-proBNP and HF Events
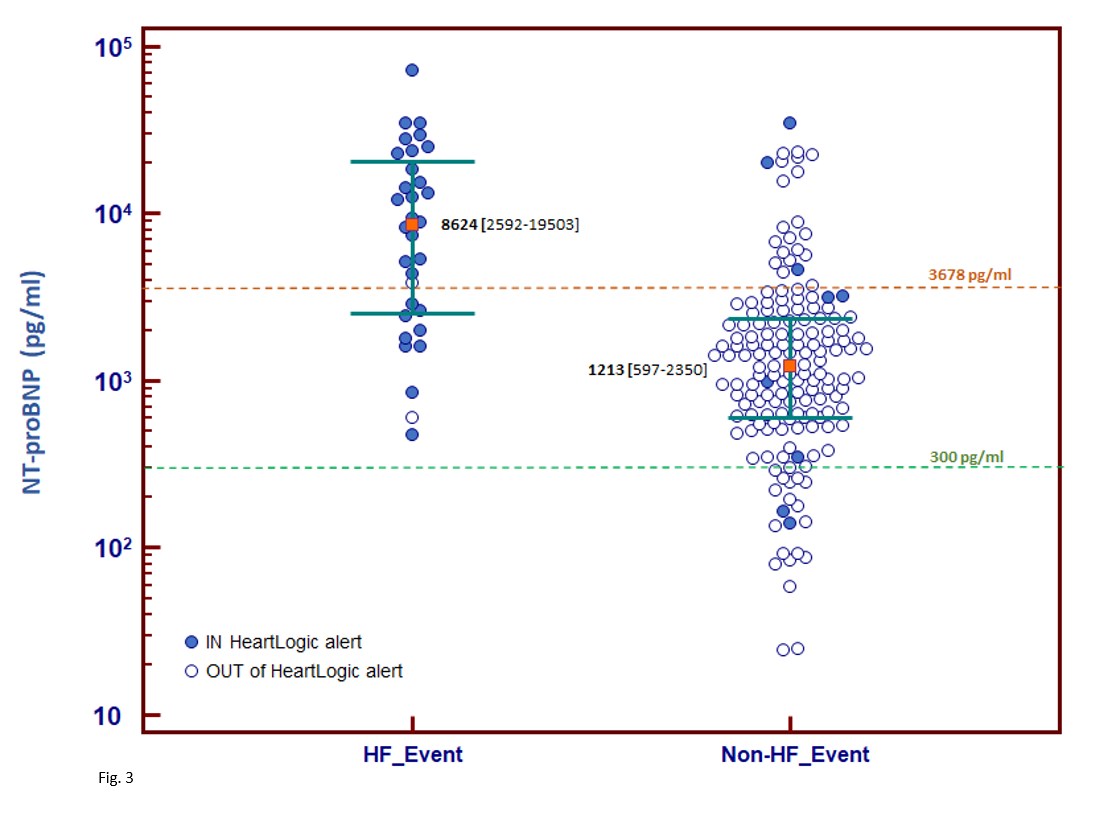
The median NT-proBNP value was (Fig. 3):
- 8624 [2592-19503] pg/ml at the time of HF events
- 1213 [597-2350] pg/ml (p<0.001) at non-HF events (p=0.049)
HeartLogic and HF Events
The HeartLogic index was able to detect HF events with:
- 94% sensitivity
- 94% specificity
NT-proBNP and Alert state
The median NT-proBNP value was:
- 7378 [25th-75th percentile: 2214-19377] pg/ml IN alert state
- 1210 [25th-75th percentile: 599-2276] pg/ml (p<0.001) OUT of alert state
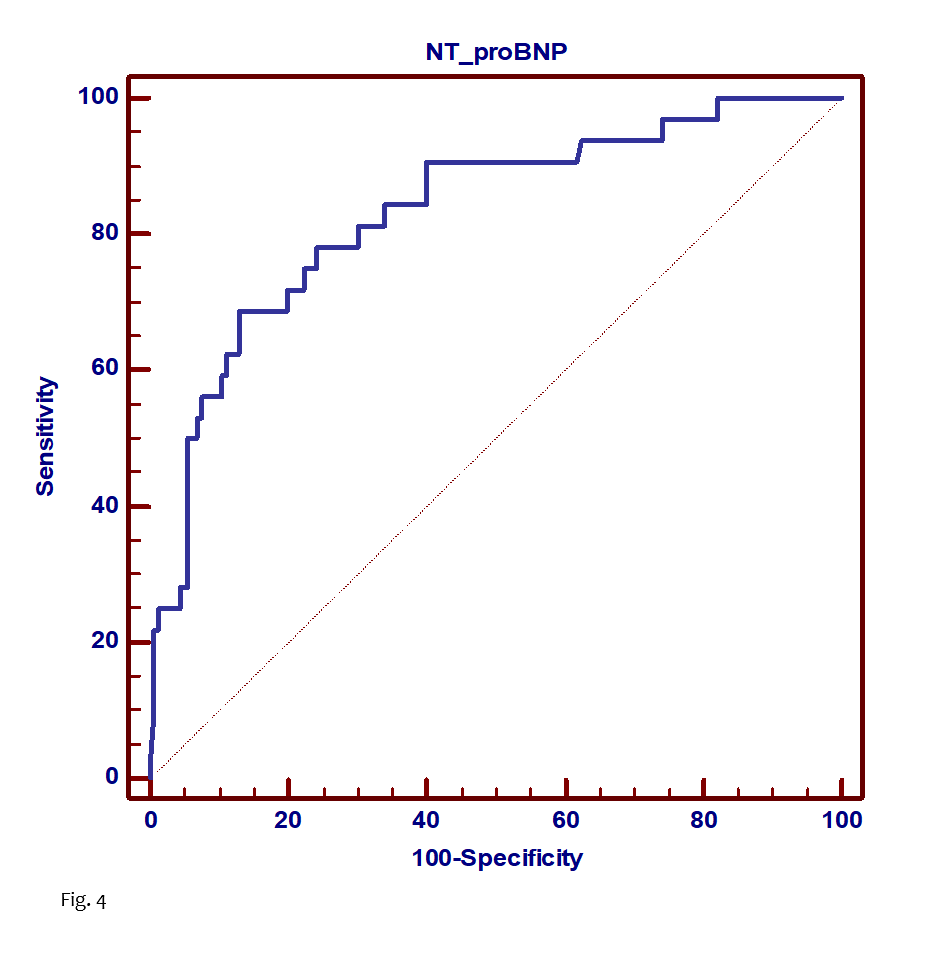
A ROC curve analysis (Fig. 4) was conducted and the NT-proBNP cutoff that best identified HF and maximized sensitivity and specificity in the study population was 3678 pg/ml (AUC = 0.83).
This cut-off enabled HF to be detected with:
- 69% (95% CI 50%–84%) sensitivity
- 87% (95% CI 81%–92%) specificity.
| Sensitivity | Specificity |
| NT-proBNP (300 pg/ml) | 100% | 12% |
| NT-proBNP (best cutoff: 3678 pg/ml) | 69% | 87% |
| HeartLogic (IN/OUT alert) | 94% | 94% |
This analysis demonstrates that:
- NT-proBNP concentrations are significantly elevated when HearLogic is on IN alert status.
- The accuracy of the HeartLogic algorithm in detecting HF decompensation seems comparable to that of NT-proBNP test.
Analysis of the implementation of a multisensory cardiac implantable electronic device algorithm-based heart failure care path in real-life practice.
Dr. Michelle Feijen - Leiden University Medical Center, Department of Cardiology – Leiden – The Netherlands
This study collected data of 82 consecutive heart failure patients with a CIED and an active HeartLogic algorithm followed according the management flow-chart reported in Fig. 5.
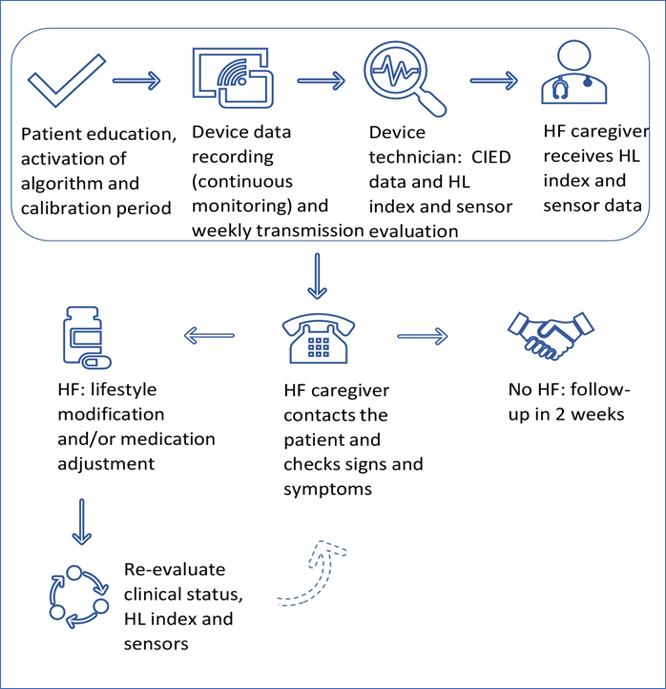
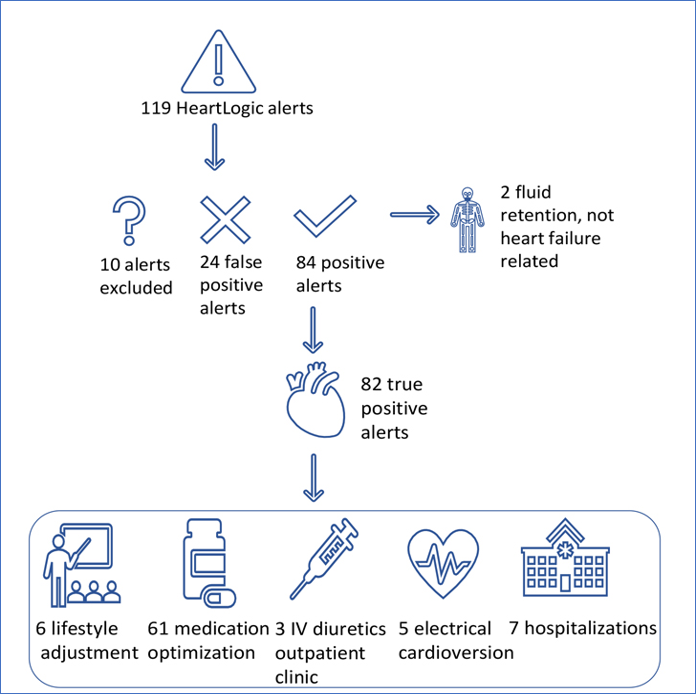
During a median follow-up of 14 months (IQR 7-23), 119 HeartLogic alerts occurred (1.07 alerts per patient-year.). 82 HeartLogic alerts have been judged TRUE Positive for HF fluid retention.
In Fig. 6 authors reported the HeartLogic alerts classification and management.
The performance of HeartLogic algorithm in this clinical setting were:
- Sensitivity: 93%
- Specificity: 97%
- Positive Predictive Value: 81%
- Negative Predictive Value: 99%
The unexplained alert rate was 0.24 alert per patient-year.Only in 17 cases the HeartLogic index didn’t cross the threshold even in presence of fluid retention.
ePosters Session
HeartLogic measurements in SARS-CoV-2 patients
Recently Dr. Gardner et al. published a new paper on the ESC Heart Failure Journal about HeartLogic sensor measurements in Covid-19 patients (ESC Heart Fail. 2021 Jun 28. doi: 10.1002/ehf2.13500).
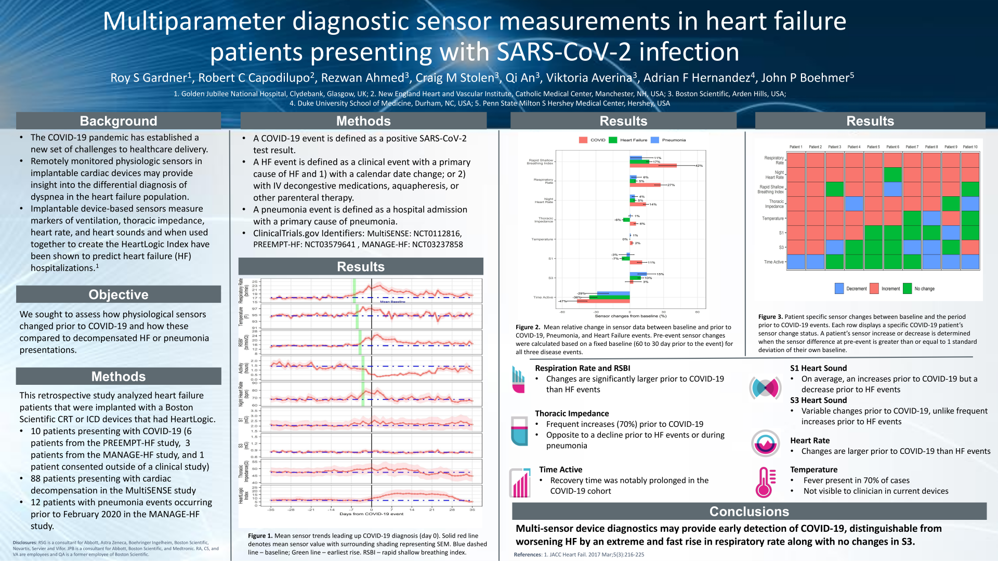
Multiparameter diagnostic sensor measurements in heart failure patients presenting with SARS-CoV-2 infection
As the most common symptoms of SARS-CoV-2 infection include cough and shortness of breath, and less than half of patients reported fever, the differentiation between heart failure and COVID-19 can be challenging and the possibility to determine causes of acute breathlessness is of great interest.
The aim of this analysis was to characterize the suite of HeartLogic sensor data, as well as changes in pulse generator temperature, in ten patients presenting with COVID-19 to assess how these differ from patients with decompensated heart failure.
This is a retrospective study that evaluated HeartLogic data from 10 patients presenting with COVID-19 and compared these with data collected from 88 patients presenting with heart failure decompensation and 12 patients with pneumonia events occurring prior to February 2020.
These data were retrieved from PREEMPT-HF, MANAGE-HF and MultiSENSE studies.
Overall, there were no statistically significant differences in the baseline clinical and demographic data between the COVID-19, pneumonia, and HF decompensation.
Sensor data findings
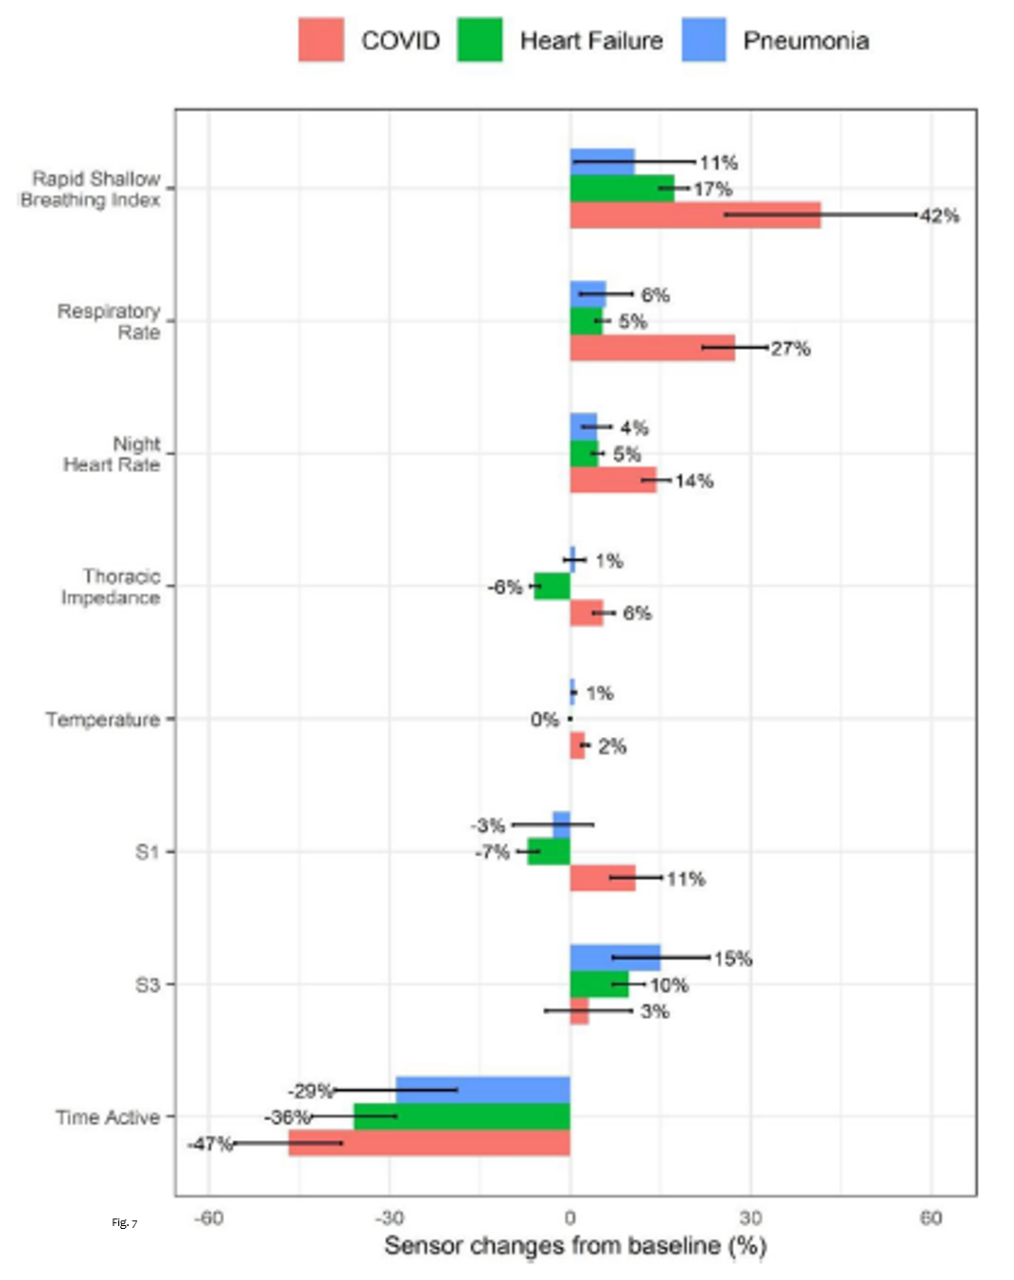
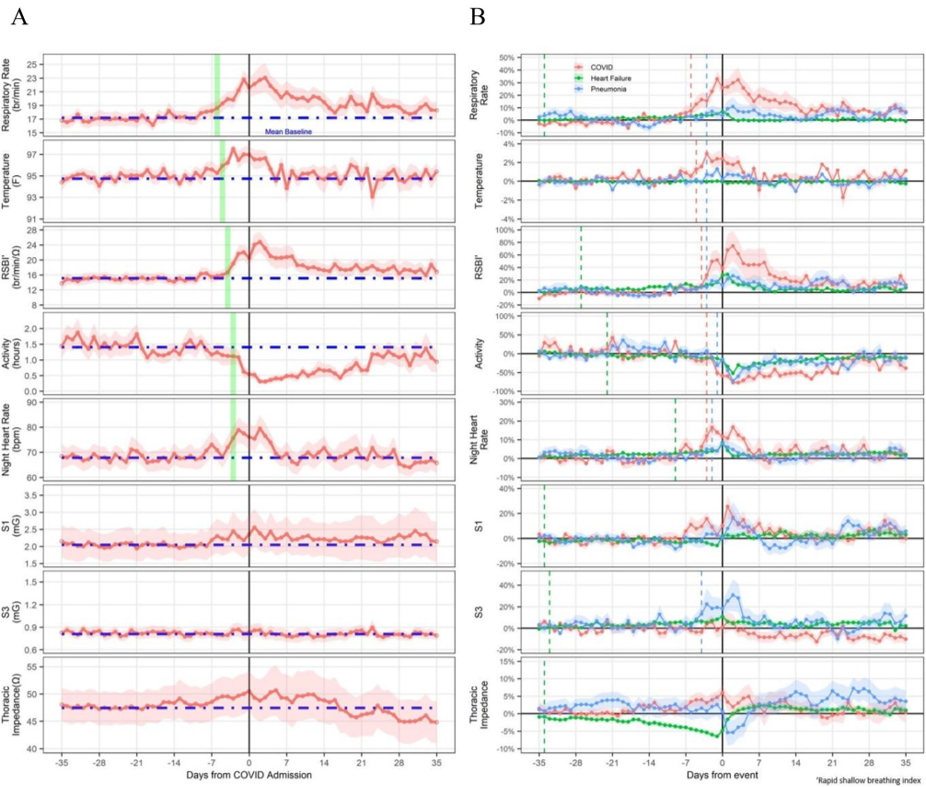
Significant differences in sensor data between baseline and prior to COVID-19, pneumonia, and heart failure events were observed (Fig. 7). The sensor changes were quantified by comparing the averaged pre-event window data (3 days including the day of admission or test) to the averaged fixed baseline data (from 60 to 30 day prior to the event) as percentage of changes.
- Rapid shallow breathing index (RSBI) was seen to increase more notably in patients with COVID-19 (mean increase of 42%).
- Respiratory Rate increased five times more in patients with COVID-19(27%) than those in other groups.
- Night-time heart rate increased prior to all presentations, but was nearly four times greater in those with COVID-19.
- Thoracic Impedance showed a small increase before the diagnosis of COVID-19, in contrast with a reduction in patients with HF (no changes in those with pneumonia).
- Temperature is a new feature currently no commercially available, but the analysis reported a 2.3% increase in temperature in patients with COVID-19.
- Heart Sounds didn’t show any significant changes in COVID-19 patients, while there were significant changes in patients with pneumonia and heart failure.
- Patient activity level decreased in all acute presentations although the fall from baseline in patients with COVID-19 was greater than those presenting with heart failure or pneumonia.
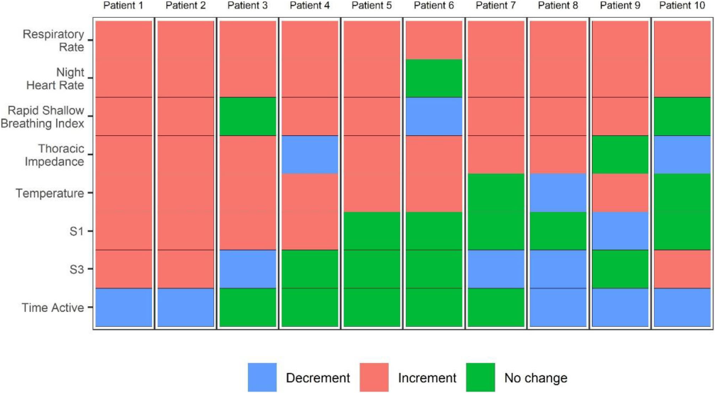
Sensor changes in COVID-19 Patients
The fig. 9 shows the sensor changes in 10 COVID-19 patients.
Conclusions
- This case series has demonstrated that several device-based features could have helped differentiate between an acute presentation with COVID-19 and cardiac decompensation.
- An alert derived from a combination of sensors including that of respiratory rate, RSBI, night-time heart rate and temperature, together with HeartLogic, could enable ambulatory patient monitoring and early triage for potential exposure to SARS-CoV-2 and heart failure exacerbation.
- The novel ability of HF devices to detect changes in temperature extend the potential utility of remote monitoring in the future.