Dear HeartLogic™ users,
In the last issue we reviewed the clinical evidence on the feasibility of automatic heart sounds measurement with ICD-embedded accelerometer.
On the same topic, in this issue it is our pleasure to share with you the findings of a study by Prof. L. Calò just published in Journal of Interventional Cardiac Electrophysiology:
"ICD-measured heart sounds and their correlation with echocardiographic indexes of systolic and diastolic function”1
The study and the results
Aim
As well known, heart sounds are closely correlated with cardiac performance: the first heart sound is related to left ventricular contractility while the third heart sound is correlated with left ventricular filling pressure.
The HeartLogic algorithm (Boston Scientific) measures and combines multiple parameters, including S3 and S1, into a single index to predict impending heart failure decompensation.
Sometimes traditional heart sounds auscultation can be impossible depending on low level of intensity and frequency that could be in the sub-audible range and extraneous noise that can occur due to body movement.
Based on this assumption, the aims of this analysis were:
- to evaluate the correlation between ICD-measured S3 and S1 and echocardiographic indexes of diastolic and systolic function;
- to evaluate the performance of device-measured S3 and S1 values as binary discriminators of restrictive filling pattern and reduced LVEF, respectively.
Results
This analysis was carried out on 104 patients who received a HeartLogic-enabled ICD or CRT-D.
All patients underwent in-office visits: 230 visits were scheduled and 22 visits were performed at the time of HeartLogic alerts.
During these visits the data of demographic and medical history, the echocardiographic evaluation and clinical examination have been collected. Moreover heart sounds auscultation and congestion assessment and grading were performed.
Evaluation of echocardiographic parameters and clinical examination
Lower values of LVEF and higher indexes of impaired left ventricular filling were more frequently measured during alert visits than during scheduled visits at paired and unpaired comparison.
The HeartLogic index was higher at both paired and unpaired comparisons, while S3 amplitude was significantly higher and S1 amplitude was lower only at unpaired comparison.
Parameter | HeartLogic <16 (n=230) | HeartLogic >16 (n=22) | HeartLogic <16 paireda (n=22) |
LV ejection fraction, % | 37±8* | 31±9 | 35±9# |
LV end-systolic volume, ml | 99±45 | 130±65 | 114±60 |
LV end-diastolic volume, ml | 153±56 | 185±72 | 162±67 |
Early-to-late transmitral filling velocity ratio (E/A) | 0.9±0.6 | 1.8±1.7 | 1.2±1.2 |
Deceleration time of E, ms | 222±76* | 178±36 | 194±51# |
Restrictive filling pattern, % | 20* | 73 | 41# |
NYHA Class III or IV, % | 21 | 38 | 23 |
Congestion grade: |
|
|
|
none, % | 78* | 59 | 64 |
mild, % | 17 | 32 | 27 |
moderate, % | 5 | 9 | 9 |
HeartLogic Index | 3±3* | 27±9 | 5±4# |
S3 amplitude, mG | 0.9±0.3* | 1.3±0.3 | 1.1±0.4 |
| S1 amplitude, mG | 2.4±0.9* | 1.9±0.9 | 1.8±0.7 |
Echocardiographic results and correlation with ICD-measured heart sounds correlation
S3 amplitude inversely and significantly correlated with deceleration time (r= -0.32; 95% CI -0.46 – -0.17; P<0.001)
S1 amplitude directly and significantly correlated with LVEF (r= 0.17; 95% CI 0.03 – 0.30; P=0.021)
ROC curve
S3 values: the cutoff that best identified restrictive filling pattern and maximized sensitivity and specificity was 0.9mG (AUC = 0.91).
This enabled restrictive filling pattern to be detected with 85% (95% CI 72% – 93%) sensitivity and 82% (95% CI 75% – 88%) specificity.
S1 values: the cutoff that best identified LVEF < 35% and maximized sensitivity and specificity was 1.5mG (AUC = 0.59).
This enabled LVEF<35% to be detected with 28% (95% CI 19% – 40%) sensitivity and 88% (95% CI 80% – 93%) specificity.
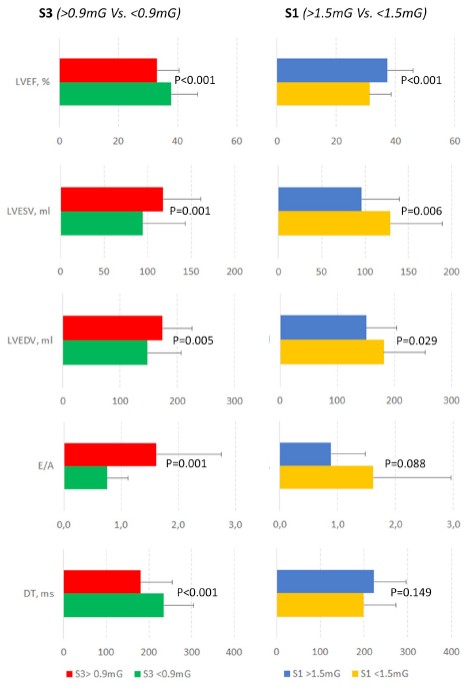
The results of the echocardiographic evaluation stratified by the S3 value (>0.9mG versus <0.9mG) and by the S1 value (>1.5mG versus <1.5mG) are reported in Figure.
Conclusion
- The analysis demonstrated the correlation between ICD-measured heart sounds and echocardiographic indexes of diastolic and systolic function: heart sounds may serve as surrogates for standard measures of left ventricular function.
- Heart sounds correlate well with HF status, and a strong association between HeartLogic alerts and HF-related clinical events seems to have been confirmed.
- Heart sounds are automatically collected by the ICD on a daily basis and, since they seemed accurate in detecting systolic and diastolic dysfunction, they may be useful for remote HF patient monitoring, either as single sensors, or in combination with other physiological ICD sensors that evaluate various aspects of HF physiology.


