A group of Boston Scientific employees gather around a leader in a warehouse while clapping and cheering.

Our workforce data

We celebrate the diverse perspectives of our employees and work together to advance science.

Sharing our progress

Truly impactful change takes time, transparency and collective action.

Since 2018, we’ve set and shared aspirational goals focused on improving the diversity of talent in our leadership roles, with a focus on women and multicultural representation. Our aspirational goals are an indicator of progress, but our primary focus is placed on developing impactful programs and initiatives across our strategic imperatives.

2030 aspirational leadership goals

Our aspirational goals focus on increasing multicultural and women representation within mid-level leadership1 roles. This is the pipeline of talent leading to senior leadership roles, as well as a critical segment of the organization that can help nurture the professional growth of those who are in the earlier stages of their careers. By 2030, we aspire to improve the gender, race and ethnicity balance of our mid-level leadership team, as follows:

50%

Women2

mid-level leadership

(Global)

from a 43.5% baseline in 2023

27%

Multicultural talent3

mid-level leadership

(U.S./Puerto Rico)

from a 22.6% baseline in 2023

seramount logo 2023

Upholding inclusion for all

We are proud to be consistently recognized for our efforts and will strive to maintain our status as a global leader for workplace inclusion in key focus areas that include, but are not limited to, women, multicultural talent, individuals with disabilities and LGBTQ+ individuals.

Company demographics

By transparently sharing our demographics, we acknowledge our progress over time and ongoing opportunities to improve. Below is Boston Scientific employee data as of December 31, 2023.

A bar graph showing the percentage of women at Boston Scientific increased each year from 47.0% in 2019, to 47.4%, 48.3%, 49.0% and 49.3% in 2023.

The percentage of women at Boston Scientific increased each year from 47.0% in 2019, to 47.4%, 48.3%, 49.0% and 49.3% in 2023.

A bar graph showing the percentage of women on the Board of Directors at Boston Scientific remained steady at 30.0% in years 2019 through 2022, before increasing to 36.0% in 2023.

The percentage of women on the Board of Directors at Boston Scientific remained steady at 30.0% in years 2019 through 2022, before increasing to 36.0% in 2023.

A bar graph showing the percentage of women on the Executive Committee4 at Boston Scientific remained at 25.0% in 2019 and 2020, before decreasing to 18.8% in 2021 then increasing to 25.0% in 2022 and 26.3% in 2023.

The percentage of women on the Executive Committee4 at Boston Scientific remained at 25.0% in 2019 and 2020, before decreasing to 18.8% in 2021 then increasing to 25.0% in 2022 and 26.3% in 2023.

A bar graph showing the percentage of multicultural talent by ethnic group in the U.S./Puerto Rico: American Indian/Alaskan Native talent at Boston Scientific remained steady each year at 0.3% from 2019 to 2023. Asian talent fluctuated year to year from 13.3% in 2019 to 13.6%, 12.8%, stayed at 12.8% in 2022, before increasing to 13.4% in 2023. African American/Black talent increased from 7.2% in 2019 to 7.9%, 9.2%, stayed at 9.2% in 2022, before increasing to 9.8% in 2023. Hispanic/Latino talent decreased from 10.5% in 2019 to 10.3% in 2020, then increased each year to 11.5%, 11.9% and 12.4% in 2023. Talent identifying as two or more races increased from 1.6% in 2019 to 1.7%, stayed at 1.7% in 2021, then increased to 1.8% and 2.2% in 2023. Native Hawaiian/other Pacific Islander talent remained steady at 0.3% in 2019 and 2020, then remained steady at 0.2% from 2021 to 2023.

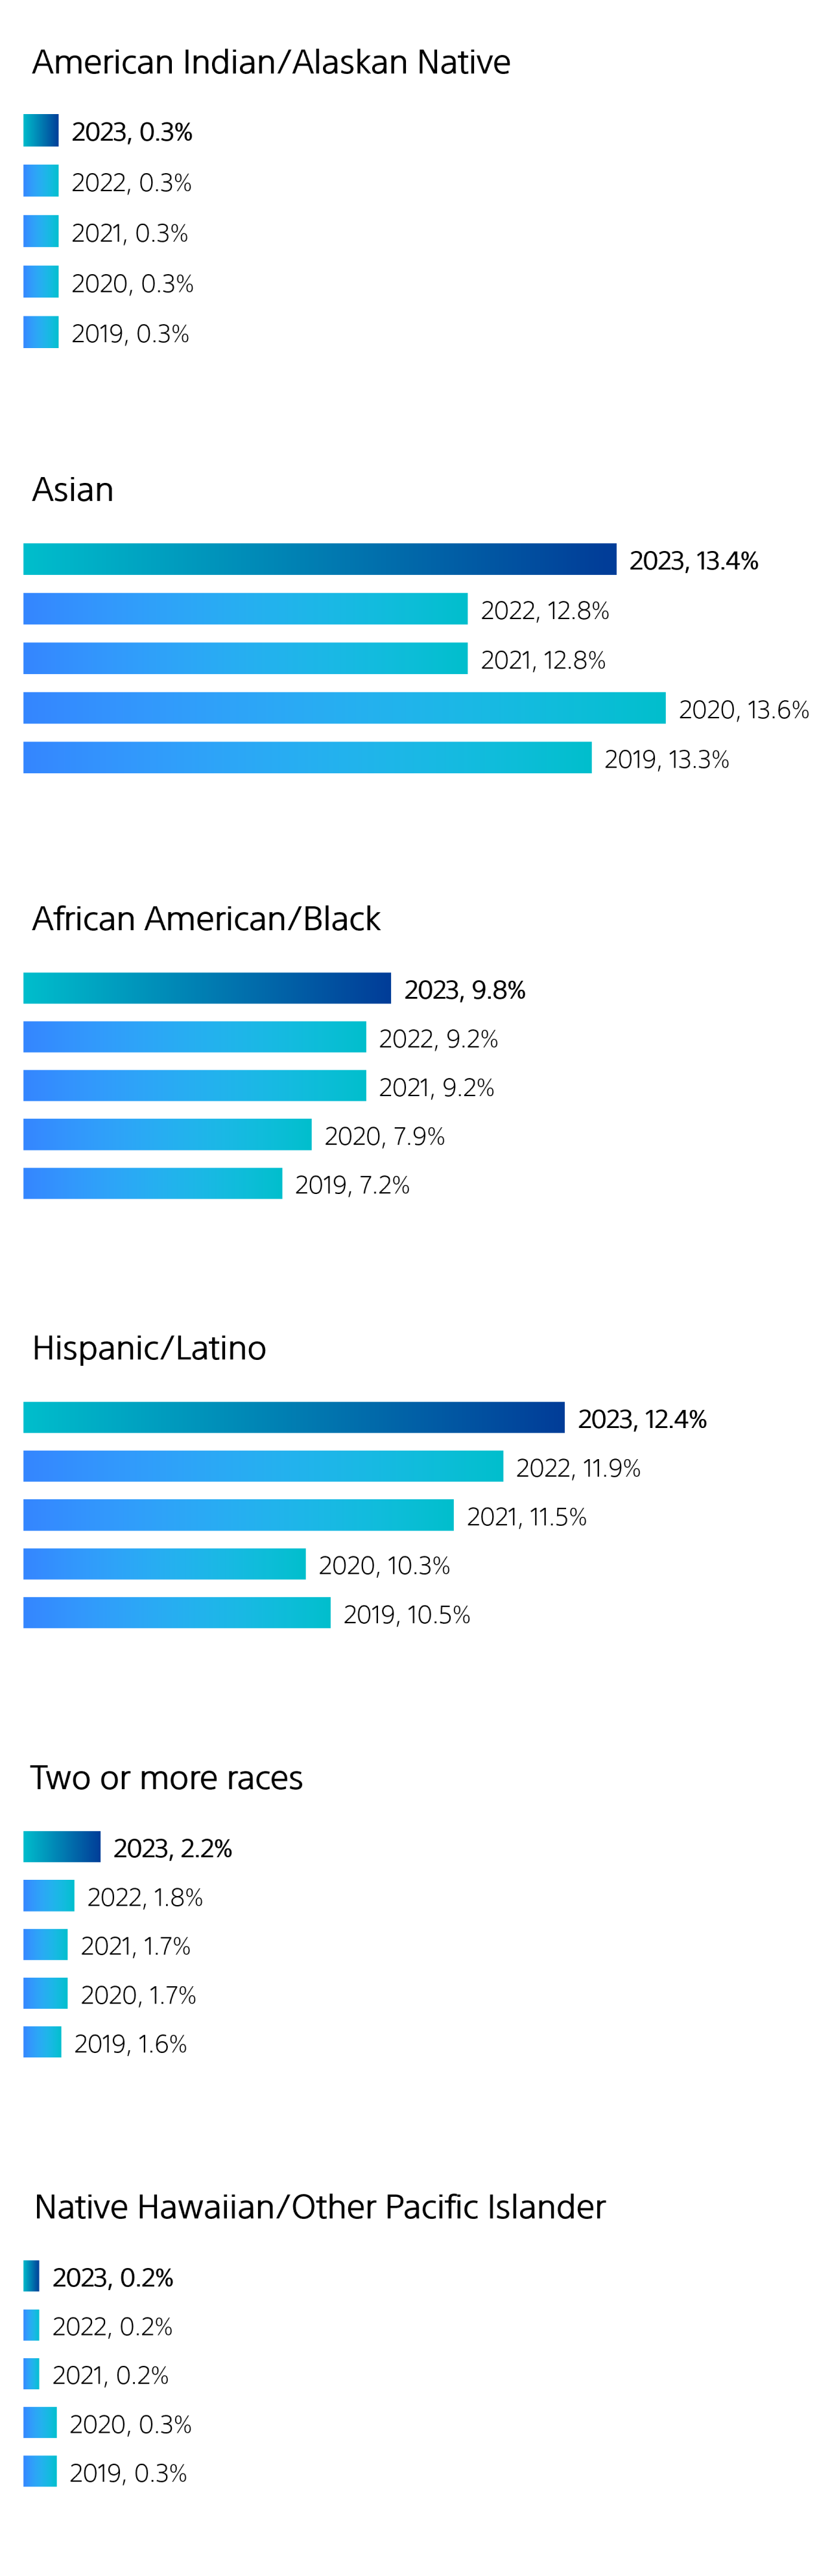
Multicultural talent by ethnic group in the U.S./Puerto Rico5: American Indian/Alaskan Native talent at Boston Scientific remained steady each year at 0.3% from 2019 to 2023. Asian talent fluctuated year to year from 13.3% in 2019 to 13.6%, 12.8%, stayed at 12.8% in 2022, before increasing to 13.4% in 2023. African American/Black talent increased from 7.2% in 2019 to 7.9%, 9.2%, stayed at 9.2% in 2022, before increasing to 9.8% in 2023. Hispanic/Latino talent decreased from 10.5% in 2019 to 10.3% in 2020, then increased each year to 11.5%, 11.9% and 12.4% in 2023. Talent identifying as two or more races increased from 1.6% in 2019 to 1.7%, stayed at 1.7% in 2021, then increased to 1.8% and 2.2% in 2023. Native Hawaiian/other Pacific Islander talent remained steady at 0.3% in 2019 and 2020, then remained steady at 0.2% from 2021 to 2023.

A bar graph showing the percentage of multicultural talent at Boston Scientific increased each year from 33.2% in 2019, 34.0%, 35.7%, 36.0% and 38.3% in 2023.

The percentage of multicultural talent at Boston Scientific increased each year from 33.2% in 2019, 34.0%, 35.7%, 36.0% and 38.3% in 2023.

A bar graph showing the percentage of talent under 30 years of age increased from 18.3% in 2019 to 21.5%, 24.2% and 24.9%, before decreasing to 24.0% in 2023. Talent from 30 to 50 years of age decreased from 61.1% in 2019 to 59.8%, 58.0% and 57.4%, before increasing to 58.2% in 2023. Talent over 50 years of age decreased from 20.6% in 2019 to 18.7%, 17.8% and 17.7%, before increasing to 17.8% again in 2023.

Talent under 30 years of age increased from 18.3% in 2019 to 21.5%, 24.2% and 24.9%, before decreasing to 24.0% in 2023. Talent from 30 to 50 years of age decreased from 61.1% in 2019 to 59.8%, 58.0% and 57.4%, before increasing to 58.2% in 2023. Talent over 50 years of age decreased from 20.6% in 2019 to 18.7%, 17.8% and 17.7%, before increasing to 17.8% again in 2023.

A bar graph showing the percetnage of talent under 30 years of age increased from 14.0% in 2019 to 16.1% and 18.9% in 2021, before decreasing to 18.8% and 18.6% in 2023. Talent from 30 to 50 years of age decreased from 57.8% in 2019 to 57.6%, 56.1% and 55.7%, before increasing to 56.0% in 2023. Talent over 50 years of age decreased from 28.1% in 2019 to 26.3% and 25.0% in 2021, before fluctuating to 25.5% and 25.4% in 2023.

Talent under 30 years of age increased from 14.0% in 2019 to 16.1% and 18.9% in 2021, before decreasing to 18.8% and 18.6% in 2023. Talent from 30 to 50 years of age decreased from 57.8% in 2019 to 57.6%, 56.1% and 55.7%, before increasing to 56.0% in 2023. Talent over 50 years of age decreased from 28.1% in 2019 to 26.3% and 25.0% in 2021, before fluctuating to 25.5% and 25.4% in 2023.

A bar graph showing the percentage of women new hires at Boston Scientific decreased from 50.2% in 2019 to 48.9% in 2020, before increasing to 51.7%, 51.8% and 51.9% in 2023.

The percentage of women new hires at Boston Scientific decreased from 50.2% in 2019 to 48.9% in 2020, before increasing to 51.7%, 51.8% and 51.9% in 2023.

A bar graph showing the percentage of multicultural new hires at Boston Scientific fluctuated year to year from 43.5% in 2019 to 42.5%, 49.5% and 41.4%, before increasing to 48.9% in 2023.

The percentage of multicultural new hires at Boston Scientific fluctuated year to year from 43.5% in 2019 to 42.5%, 49.5% and 41.4%, before increasing to 48.9% in 2023.


Committed to transparency

Additional information is available within our recently filed U.S. Federal Employer Information Reports EEO-1. While we offer this data, we believe the information presented on our website is the most meaningful measure of our diversity, equity and inclusion progress.

Join our team

  1. Mid-level leadership includes managers, principals, senior managers and fellows.
  2. Gender includes all employees globally where gender is identified. Excludes any employees where gender is “undeclared” and “unknown.”
  3. Multicultural talent in the U.S. and Puerto Rico is defined as African American/Black, Asian, Hispanic/Latino, American Indian/Alaskan, Native Hawaiian/Other Pacific Islander, and two or more races. Excludes any employees who choose not to self-identify.
  4. Executive committee includes all executive committee members as of December 31 of that calendar year.
  5. Reflects Equal Employment Opportunity (EEO) race/ethnicity categories.

All data as of December 31, 2023, unless otherwise noted.